Open Access
Fig. 11
Download original image
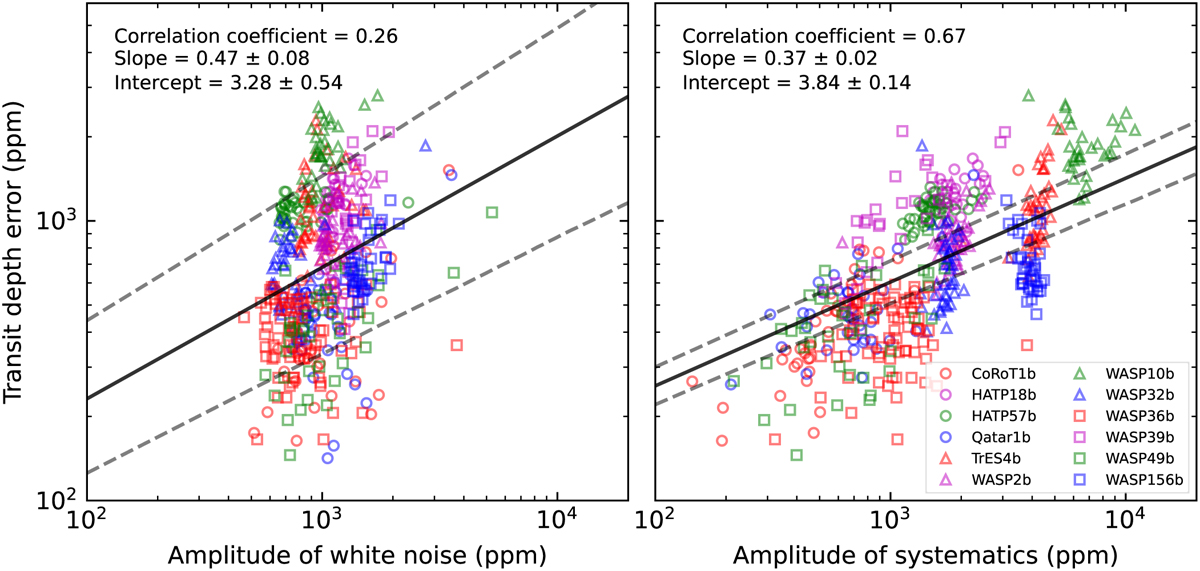
Correlations between the chromatic transit depth errors and light-curve noise. Left panel: transit depth errors and light-curve white noise. Right panel: transit depth errors and light-curve systematic noise. The solid lines are the best-fit linear regression results, and the dashed lines indicate the 1σ credible intervals.
Current usage metrics show cumulative count of Article Views (full-text article views including HTML views, PDF and ePub downloads, according to the available data) and Abstracts Views on Vision4Press platform.
Data correspond to usage on the plateform after 2015. The current usage metrics is available 48-96 hours after online publication and is updated daily on week days.
Initial download of the metrics may take a while.