Fig. 10
Download original image
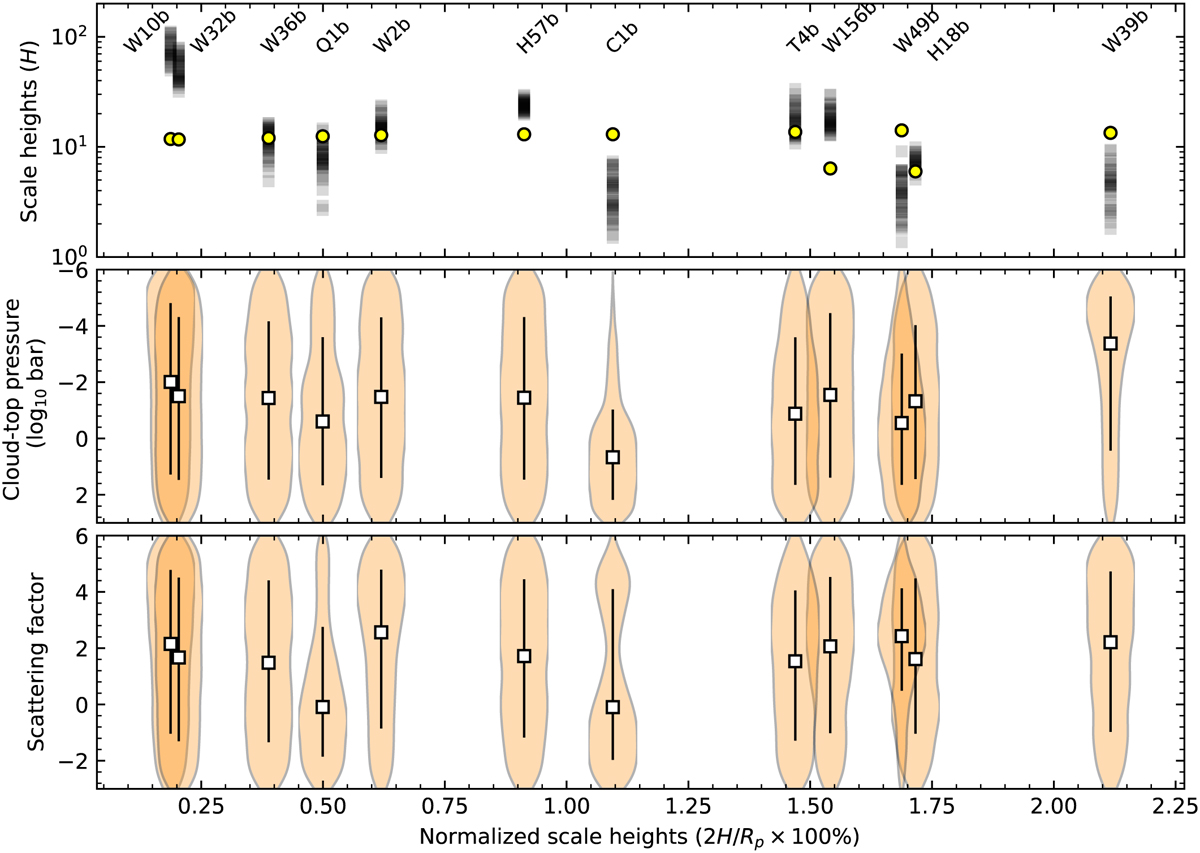
Population analysis on the observed targets. Upper panel: observational errors of the chromatic transit depths in unit of scale heights (gray squares) compared with the nominal amplitudes of the sodium D-lines assuming clear atmospheres (yellow dots). Middle panel: posterior distributions of the cloud-top pressures from the retrieved atmospheric models assuming chemical equilibrium. Lower panel: posterior distributions of the scattering factors from the retrieved atmospheric models assuming chemical equilibrium. The error bars indicate the 1σ credible intervals.
Current usage metrics show cumulative count of Article Views (full-text article views including HTML views, PDF and ePub downloads, according to the available data) and Abstracts Views on Vision4Press platform.
Data correspond to usage on the plateform after 2015. The current usage metrics is available 48-96 hours after online publication and is updated daily on week days.
Initial download of the metrics may take a while.