Open Access
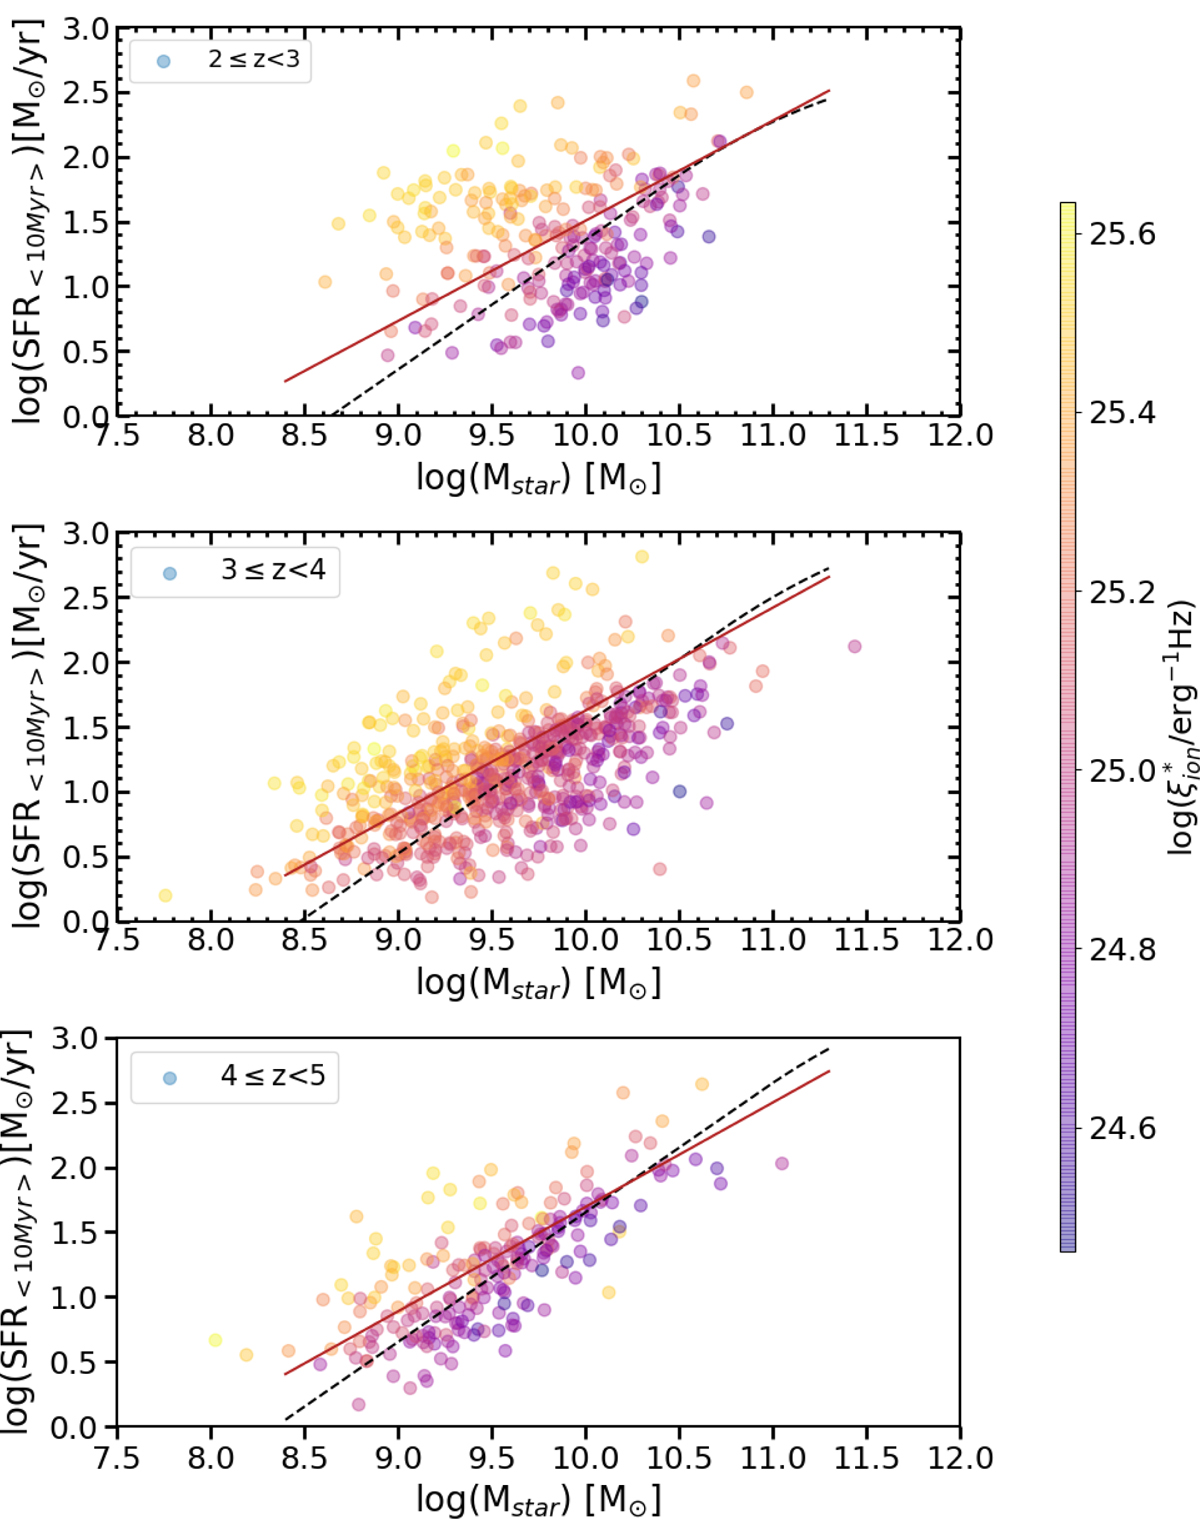
Fig. 7.
Download original image
VANDELS sample on the SFR vs. Mstar plane. Each object is color-coded according to the relevant ![]() value. The best-fit estimates of the main sequence of star formation by Speagle et al. (2014) and by Schreiber et al. (2015) are shown as a continuous red line and a dashed black curve, respectively.
value. The best-fit estimates of the main sequence of star formation by Speagle et al. (2014) and by Schreiber et al. (2015) are shown as a continuous red line and a dashed black curve, respectively.
Current usage metrics show cumulative count of Article Views (full-text article views including HTML views, PDF and ePub downloads, according to the available data) and Abstracts Views on Vision4Press platform.
Data correspond to usage on the plateform after 2015. The current usage metrics is available 48-96 hours after online publication and is updated daily on week days.
Initial download of the metrics may take a while.