Fig. 4.
Download original image
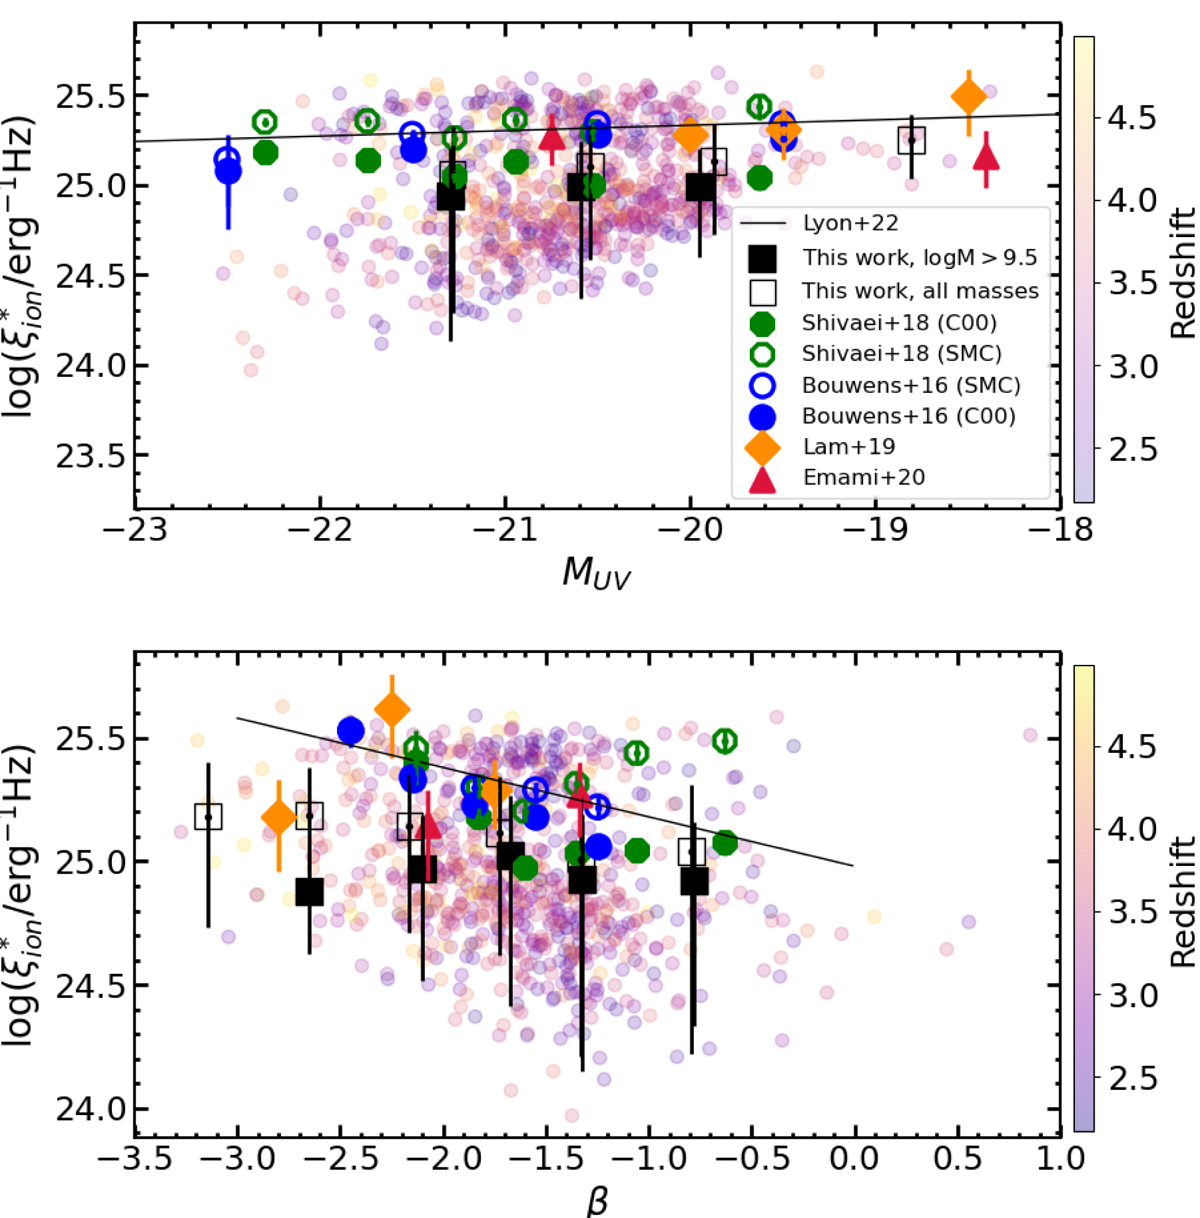
![]() as a function of MUV (top) and UV slope (bottom). The VANDELS objects are color-coded according to the relevant redshift. The empty and filled black squares and error bars show the average and standard deviation for the entire sample and for galaxies with log(Mstar/M⊙) > 9.5, respectively. The VANDELS sample is compared to measurements from the literature by Shivaei et al. (2018; LBGs at z ∼ 2 − 3), Emami et al. (2020; lensed dwarf galaxies at 1.4 < z < 2.7), and Bouwens et al. (2016) and Lam et al. (2019; LBGs at z ∼ 4 − 5). See the legend for symbols and colors. The continuous black lines show the relations measured by Prieto-Lyon et al. (2023) on sub-L* galaxies at z ∼ 3 − 7.
as a function of MUV (top) and UV slope (bottom). The VANDELS objects are color-coded according to the relevant redshift. The empty and filled black squares and error bars show the average and standard deviation for the entire sample and for galaxies with log(Mstar/M⊙) > 9.5, respectively. The VANDELS sample is compared to measurements from the literature by Shivaei et al. (2018; LBGs at z ∼ 2 − 3), Emami et al. (2020; lensed dwarf galaxies at 1.4 < z < 2.7), and Bouwens et al. (2016) and Lam et al. (2019; LBGs at z ∼ 4 − 5). See the legend for symbols and colors. The continuous black lines show the relations measured by Prieto-Lyon et al. (2023) on sub-L* galaxies at z ∼ 3 − 7.
Current usage metrics show cumulative count of Article Views (full-text article views including HTML views, PDF and ePub downloads, according to the available data) and Abstracts Views on Vision4Press platform.
Data correspond to usage on the plateform after 2015. The current usage metrics is available 48-96 hours after online publication and is updated daily on week days.
Initial download of the metrics may take a while.