Fig. 3.
Download original image
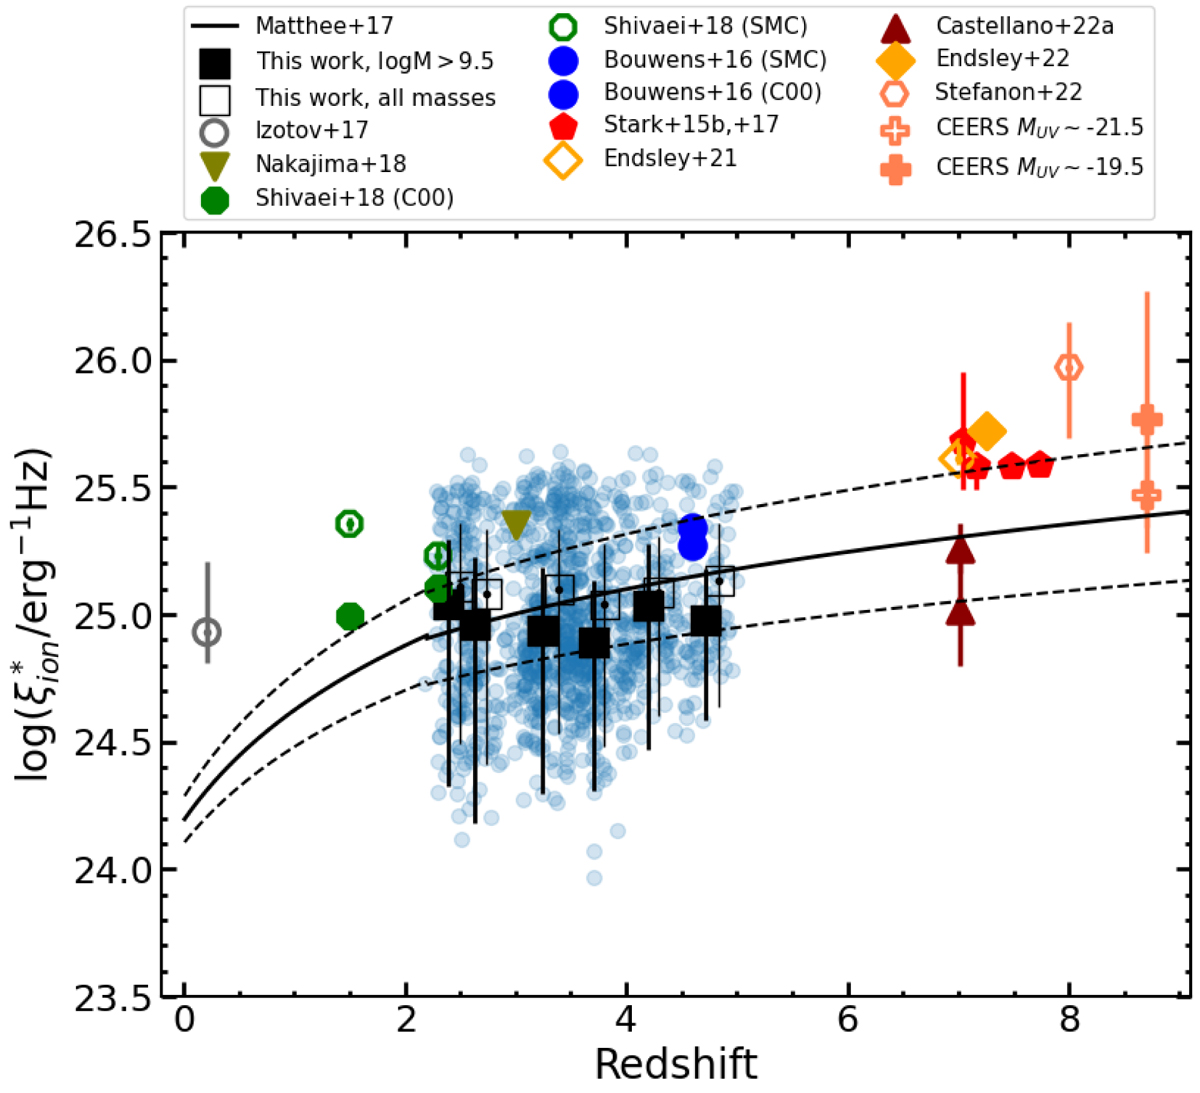
![]() as a function of redshift. The empty and filled black squares and error bars show the average and standard deviation for all VANDELS objects and for those with log(Mstar/M⊙) > 9.5, respectively. Individual VANDELS sources are shown as blue circles. The VANDELS measurements are compared to the observed
as a function of redshift. The empty and filled black squares and error bars show the average and standard deviation for all VANDELS objects and for those with log(Mstar/M⊙) > 9.5, respectively. Individual VANDELS sources are shown as blue circles. The VANDELS measurements are compared to the observed ![]() vs. redshift relation by Matthee et al. (2017; continuous and dashed black lines show the average and the dispersion, respectively) and to measurements from the literature for SDSS compact star-forming galaxies (Izotov et al. 2017), LBGs at z ∼ 2 − 3 (Shivaei et al. 2018) and z ∼ 4 − 5 (Bouwens et al. 2016), star-forming galaxies at z ∼ 2 − 4 (Nakajima et al. 2018), individual objects at z ∼ 7 − 8 (Stark et al. 2015b, 2017; Castellano et al. 2022b), bright (Endsley et al. 2021b) and faint (Endsley et al. 2023) LBGs at z ∼ 7, LBGs at z ∼ 8 (Stefanon et al. 2022), and bright and faint LBGs at z ∼ 8 − 9 observed with JWST-NIRSpec by the CEERS ERS survey (Fujimoto et al. 2023). The measurements by Shivaei et al. (2018) and Bouwens et al. (2016) are shown for both the SMC extinction law and the Calzetti et al. (2000) attenuation law. See the legend for symbols and colors.
vs. redshift relation by Matthee et al. (2017; continuous and dashed black lines show the average and the dispersion, respectively) and to measurements from the literature for SDSS compact star-forming galaxies (Izotov et al. 2017), LBGs at z ∼ 2 − 3 (Shivaei et al. 2018) and z ∼ 4 − 5 (Bouwens et al. 2016), star-forming galaxies at z ∼ 2 − 4 (Nakajima et al. 2018), individual objects at z ∼ 7 − 8 (Stark et al. 2015b, 2017; Castellano et al. 2022b), bright (Endsley et al. 2021b) and faint (Endsley et al. 2023) LBGs at z ∼ 7, LBGs at z ∼ 8 (Stefanon et al. 2022), and bright and faint LBGs at z ∼ 8 − 9 observed with JWST-NIRSpec by the CEERS ERS survey (Fujimoto et al. 2023). The measurements by Shivaei et al. (2018) and Bouwens et al. (2016) are shown for both the SMC extinction law and the Calzetti et al. (2000) attenuation law. See the legend for symbols and colors.
Current usage metrics show cumulative count of Article Views (full-text article views including HTML views, PDF and ePub downloads, according to the available data) and Abstracts Views on Vision4Press platform.
Data correspond to usage on the plateform after 2015. The current usage metrics is available 48-96 hours after online publication and is updated daily on week days.
Initial download of the metrics may take a while.