Fig. 2.
Download original image
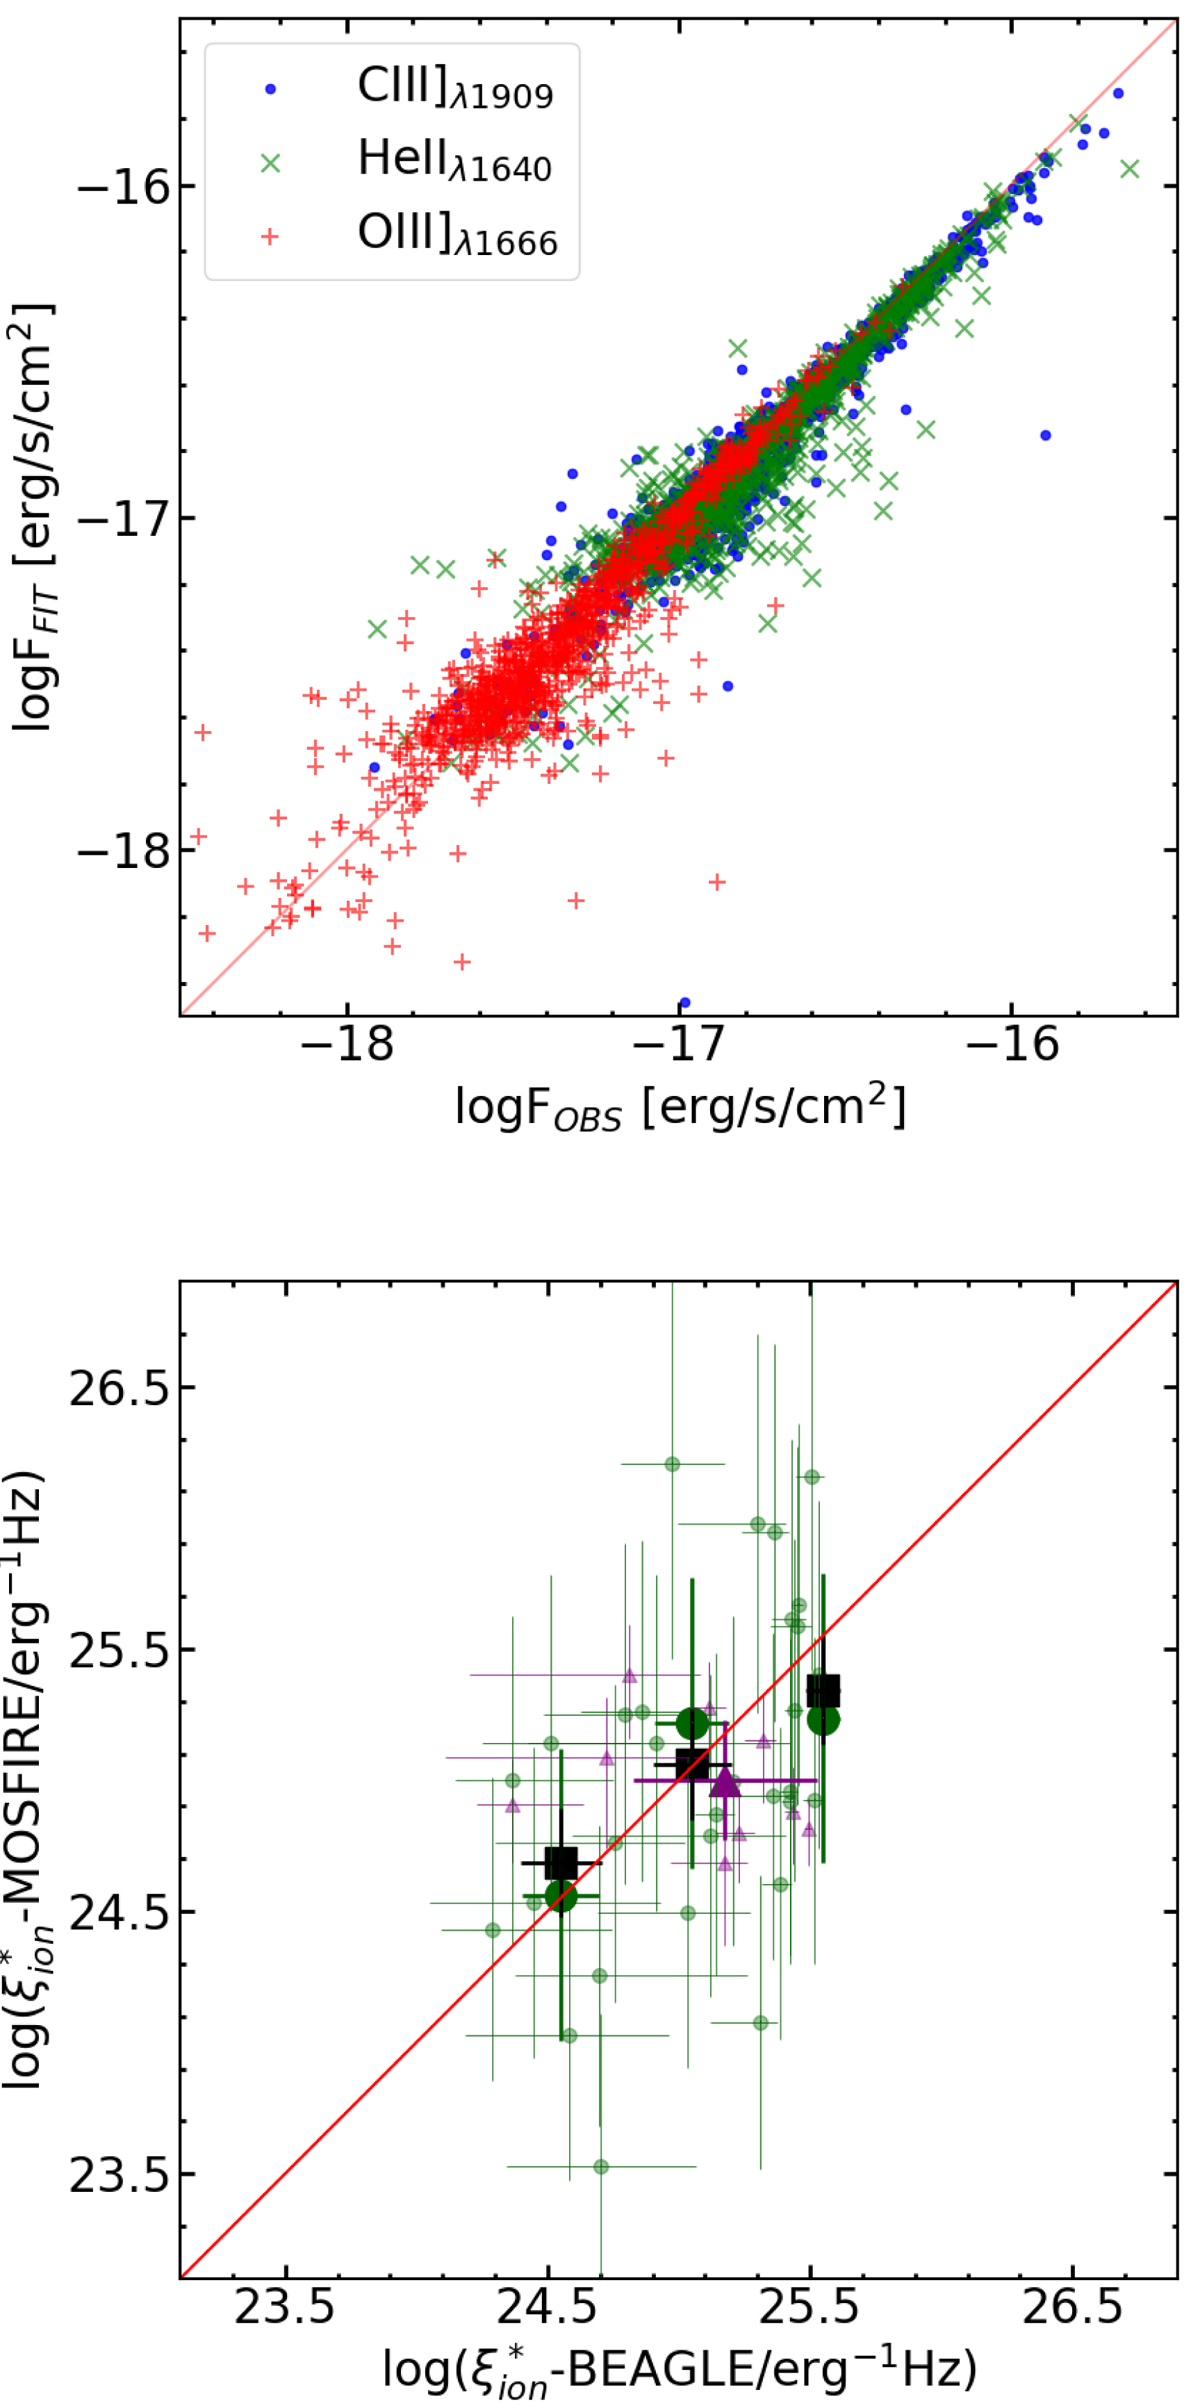
Tests of the accuracy of the BEAGLE SED-fitting results. Top: comparison between the BEAGLE best-fit flux and the observed flux of the lines used in the spectrophotometric fitting. Bottom: comparison between the ![]() estimated by BEAGLE and the measurement based on optical emission lines for the NIRVANDELS objects observed with MOSFIRE. Measurements based on the EW([OIII])–
estimated by BEAGLE and the measurement based on optical emission lines for the NIRVANDELS objects observed with MOSFIRE. Measurements based on the EW([OIII])–![]() relation by Chevallard et al. (2018) or on Hα luminosity are shown as green circles and magenta triangles, respectively. Larger symbols and error bars indicate the relevant median and dispersion. The filled black squares and error bars show the median and dispersion in bins of Δ log(
relation by Chevallard et al. (2018) or on Hα luminosity are shown as green circles and magenta triangles, respectively. Larger symbols and error bars indicate the relevant median and dispersion. The filled black squares and error bars show the median and dispersion in bins of Δ log(![]() − BEAGLE) = 0.5 for all objects with either an Hα or an [OIII] measurement.
− BEAGLE) = 0.5 for all objects with either an Hα or an [OIII] measurement.
Current usage metrics show cumulative count of Article Views (full-text article views including HTML views, PDF and ePub downloads, according to the available data) and Abstracts Views on Vision4Press platform.
Data correspond to usage on the plateform after 2015. The current usage metrics is available 48-96 hours after online publication and is updated daily on week days.
Initial download of the metrics may take a while.