Fig. 6.
Download original image
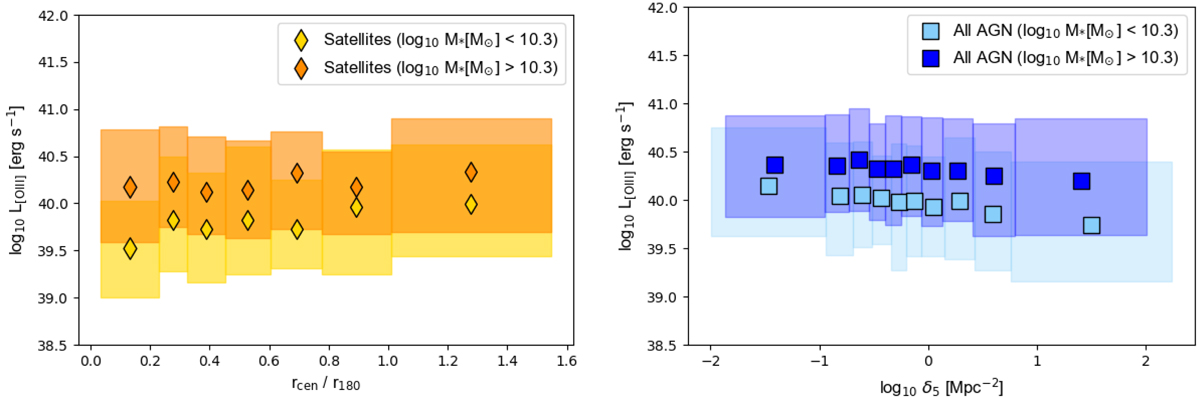
Average L[O III] for AGN as a function of environmental parameters. Left panel: L[O III] in bins of normalized distance to the central galaxy of the group, rcen/r180, for AGN satellites. Right panel: L[O III] in bins of projected surface density to the nearest 5th neighbour, δ5, for all the AGNs in our sample, split into lower- and higher-mass samples. Bottom and top values of the boxes denote the 16th and 84th percentiles of the L[O III] distributions in each bin. Bins in each plot were defined to include at least 25 (left) and 100 galaxies (right) galaxies, respectively.
Current usage metrics show cumulative count of Article Views (full-text article views including HTML views, PDF and ePub downloads, according to the available data) and Abstracts Views on Vision4Press platform.
Data correspond to usage on the plateform after 2015. The current usage metrics is available 48-96 hours after online publication and is updated daily on week days.
Initial download of the metrics may take a while.