| Issue |
A&A
Volume 675, July 2023
|
|
|---|---|---|
| Article Number | A41 | |
| Number of page(s) | 9 | |
| Section | Extragalactic astronomy | |
| DOI | https://doi.org/10.1051/0004-6361/202346051 | |
| Published online | 30 June 2023 | |
The impact of environmental effects on active galactic nuclei: A decline in the incidence of ionized outflows
1
Centro de Astrobiología, (CAB, CSIC–INTA), Dpto. Astrofísica, Ctra. de Ajalvir Km. 4, 28850 Torrejón de Ardoz, Madrid, Spain
e-mail: brodriguez@cab.inta-csic.es
2
Instituto de Física, Universidade Federal do Rio Grande do Sul (UFRGS), Av. Bento Gonçalves, 9500 Porto Alegre, RS, Brazil
3
Instituto de Astrofísica de Andalucía. CSIC, Apartado de correos 3004, 18080 Granada, Spain
Received:
1
February
2023
Accepted:
1
April
2023
Active galactic nuclei (AGNs) have generally been considered to be less frequent in denser environments due to a lower number of galaxy-galaxy interactions and/or the removal of their gas-rich reservoirs by the dense intergalactic medium. However, recent observational and theoretical works suggest that the effect of ram-pressure stripping acting on galaxies in dense environments might reduce the angular momentum of their gas, causing it to infall towards the super massive black hole at their centre, activating the AGN phase. In this work we explore the connection between environment and nuclear activity by evaluating the variation in the incidence of ionized outflows, a common phenomenon associated with nuclear activity, in AGNs across different environments. We select a sample of approximately 3300 optical AGNs from the Sloan Digital Sky Survey Data Release 13, which we match with a group catalogue to identify galaxies in isolation or residing in groups. We further probe their environments through the projected distance to the central galaxy of the group or cluster and the projected surface density to the fifth neighbour (δ5). The presence of ionized outflows is determined through the modelling of the [O III] λ5007 emission line. We find that at lower masses (< 1010.3 M⊙), the fraction of ionized outflows is significantly lower in satellite AGNs (∼7%) than in isolated (∼22%) AGNs, probably due to their different AGN luminosity, L[O III], in this stellar mass range. The fraction of outflows decreases at distances closer to the central galaxy of the group or cluster for all satellite AGNs; however, only the lower-mass ones (109 − 1010.3 M⊙) display a significant decline with δ5. Although this study does not include AGNs in the densest regions of galaxy clusters, our findings suggest that AGNs in dense environments accrete less gas than those in the field, potentially due to the removal of the gas reservoirs via stripping or starvation, leading to a negative connection between environment and AGN activity. Based on our results, we propose that the observed change in the incidence of outflows when moving towards denser regions of groups and clusters could contribute to the higher gas metallicities of cluster galaxies compared to field galaxies, especially at lower masses.
Key words: galaxies: active / galaxies: clusters: general / galaxies: kinematics and dynamics / ISM: jets and outflows
© The Authors 2023
 Open Access article, published by EDP Sciences, under the terms of the Creative Commons Attribution License (https://creativecommons.org/licenses/by/4.0), which permits unrestricted use, distribution, and reproduction in any medium, provided the original work is properly cited.
This article is published in open access under the Subscribe to Open model. Subscribe to A&A to support open access publication.
1. Introduction
Galaxies evolve through cosmic time subject to the availability of gas reservoirs that can fuel star formation and feed the supermassive black holes (SMBH) at their centres. However, the availability and properties of the gas might be altered by processes taking place within galaxies or from interactions with their close environment. Internally, one of the processes that is considered very relevant to galaxy evolution is the feedback from active galactic nuclei (AGNs) in the form of radiation, winds, and jets that originate as a consequence of the feeding of the SMBH, as it can lead to the heating or ejection of the gas in the interstellar medium (see Fabian 2012, for a review). The feedback from the AGN is believed to play a crucial role in the evolution of galaxies by, for instance, preventing excessive galaxy growth through gas accretion, which would lead to many more massive systems than observed (Kormendy & Ho 2013, and references therein). Externally, galaxies can experience strong interactions with other galaxies via mergers (Matzko et al. 2022, and references therein) or tidal encounters (Martig & Bournaud 2008, and references therein), which can lead to a more efficient consumption of gas by triggering AGN activity and star formation. Additionally, galaxies residing in galaxy groups and clusters interact with the surrounding high-density media via processes such as the removal of hot, diffuse gas when a small halo is accreted by a larger one (‘strangulation’; Larson et al. 1980; Van Den Bosch et al. 2008) or the removal of gas from the galaxy when the external pressure is sufficiently high (ram-pressure stripping; Gunn & Gott 1972).
Given that environmental processes acting on galaxies can have a strong effect on their gas reservoirs, such processes might also be connected with the fuelling of AGN activity. Such a connection has been investigated by several works, and their authors have generally found a lower fraction of AGNs in galaxy clusters, ascribing this finding to either less frequent interactions between galaxies in denser regions that could trigger AGN activity (Gisler 1978; Dressler et al. 1985; Popesso & Biviano 2006; Pimbblet et al. 2013; Lopes et al. 2017) or to a lack of a cold gas supply to feed the SMBH (Sabater et al. 2013). However, other works have reported that the AGN fraction remains roughly constant at different local densities (Miller et al. 2003; Martini et al. 2006; Rodríguez del Pino et al. 2017). Interestingly, the regions where AGN hosts reside tend to contain a higher fraction of blue star-forming galaxies than regions around galaxies with no AGN (Coldwell et al. 2014), indicating that AGNs are prone to being located in gas-rich environments. In such a case, the lower fraction of AGNs in galaxy groups and clusters could be explained by the lack of gas-rich regions caused by environmental effects.
The study of the connection between AGN activity and environment received new insights through the work by Poggianti et al. (2017a), as the authors found AGN activity in six out of seven massive galaxies (4 × 10¹⁰ − 3 × 10¹¹ M⊙) undergoing extreme ram-pressure stripping (so-called jellyfish galaxies because of the striking tails of stripped gas that resemble the tentacles of the animal). This result was interpreted as evidence that strong interactions with the intracluster medium (ICM) could trigger AGN activity. This interpretation was further supported by the fact that most of the galaxies presented relative velocities and projected distances within the cluster (i.e. positions in the cluster phase-space diagram) compatible with intense ram-pressure stripping. The work was then extended by Peluso et al. (2022) to a larger sample of 115 jellyfish galaxies, and the authors found that these galaxies have a 1.5-time higher probability to host an AGN than a similar, non-jellyfish star-forming galaxy and that the incidence of AGNs in jellyfish galaxies increases with stellar mass. However, as discussed in Boselli et al. (2022), the results from Poggianti et al. (2017a) are based on a very limited sample of galaxies and therefore suffer from low-number statistics, whereas in Peluso et al. (2022) the AGN sample also included low-ionization nuclear emission-line regions (LINERs) that are not always associated with nuclear activity (Singh et al. 2013; Belfiore et al. 2016). A different result was obtained with the rich population of 70 jellyfish galaxies in the multi-cluster system A901/2 at z ∼ 0.165. Roman-Oliveira et al. (2019) found that only 7% of this sample displayed signs of AGN activity. In their work, Roman-Oliveira et al. (2019) included jellyfish galaxies with different degrees of stripping and a wider range of stellar masses (109 − 1011.5 M⊙), and they identified AGN activity through the WHAN diagnostic diagram (Cid Fernandes et al. 2010) instead of the BPT diagram (Baldwin et al. 1981) used in other works. Nevertheless, by applying the WHAN AGN selection criteria, Roman-Oliveira et al. (2019) found only an approximately 20% AGN incidence in a sample of 42 jellyfish galaxies from the parent sample the galaxies studied in Poggianti et al. (2017a) were taken from (i.e. the GASP survey Poggianti et al. 2017b).
In addition to being associated with galaxy clusters, recent studies have also found galaxies undergoing ram-pressure stripping in lower-density groups of halo masses of approximately 1013 M⊙, although in these environments the frequency and strength of the jellyfish feature appears much smaller than in clusters (Roberts et al. 2021; Kolcu et al. 2022). In the work by Kolcu et al. (2022), the authors found that only two of their 30 tentative jellyfish candidates and none of their 13 securely classified jellyfish galaxies displayed optical line ratios compatible with AGN activity. Simulations of galaxies undergoing ram-pressure stripping have shown that as a consequence of the interaction with the ICM, gas in galaxies can lose angular momentum and spiral down into the central parts of a galaxy (Schulz & Struck 2001; Tonnesen & Bryan 2009, 2012). Some simulations predict that this gas can trigger AGN activity in galaxies with stellar masses above 109.5 M⊙, whereas in less massive systems, ram-pressure stripping suppresses both star formation and SMBH accretion (Marshall et al. 2018; Ricarte et al. 2020). Other theoretical works have found that when averaged over several galaxies and over long timescales, accretion onto the SMBH is significantly suppressed in clusters at all masses (109.7 − 1011.6 M⊙; Joshi et al. 2020).
In this work, we explore the connection between environmental effects and AGN activity by evaluating the occurrence of feedback processes in the galaxies that originate from the feeding of the SMBH. In particular, we focus on the study of galactic outflows since they are phenomena commonly observed in AGNs, with fractions between 25% and 40% in optically selected AGNs, and are known to increase with galaxy properties, such as the [O III] λ5007 luminosity and stellar mass (Rodríguez del Pino et al. 2019; Wylezalek et al. 2020). The motivation behind this strategy arises from the fact that if AGN activity can be triggered or hampered as a consequence of environmental effects disturbing the gas component in galaxies, a variation in the incidence of galactic outflows in AGNs across different environments would also be an indication that the environment plays a role in regulating AGN activity. In this regard, it is worth noting that galactic outflows also seem to be a common feature of AGNs in jellyfish galaxies, as found in the more detailed analysis of the jellyfish presented in Poggianti et al. (2017a) where four of the five confirmed AGNs presented signatures of ionized outflows (Radovich et al. 2019). Interestingly, in one of these four sources, George et al. (2019) found a cavity in the UV and CO J2 − 1 emission around the nucleus (∼9 kpc) dominated by ionization from the AGN. This result was interpreted as evidence for AGN feedback and environmental effects suppressing star formation in the galaxy. Although a possible connection between environmental effects and the occurrence of outflows in AGNs has not yet been thoroughly explored in the literature, simulations, such as those carried out by Ricarte et al. (2020), have shown that AGNs triggered by ram-pressure stripping produce observable outflows that can contribute to the quenching of star formation. More general studies, such as those carried out by McGee et al. (2014) and Trussler et al. (2020), have suggested that the combination of these two mechanisms might explain the quenching of star formation in galaxies at different epochs, highlighting the fact that the mechanisms operate on different timescales and their relevance has probably changed as a function of redshift.
Finally, given that galactic outflows are considered to play a significant role in the regulation of metals in galaxies (Dayal et al. 2013; Arribas et al. 2014; Rodríguez del Pino et al. 2019), a change in the incidence of outflows in an AGN with environment could also lead to differences in the metallicities of an AGN’s host galaxy. In fact, field galaxies have been found to have lower metallicities for a given stellar mass compared to those residing in clusters (Cooper et al. 2008; Ellison et al. 2009) and in filaments (Aracil et al. 2006). These differences have been generally ascribed to galaxies in low-density environments being more gas rich and more metal poor (Wu et al. 2017) or to the accretion of metal-rich gas by satellite galaxies (Schaefer et al. 2019). In addition to these possible scenarios, a lower fraction of galactic outflows at denser regions could prevent the ejection of metal-rich gas away from the galaxies and the subsequent reduction in global metallicity.
With the aim of shedding more light on our understanding of the connection between AGN activity and environment and its impact on galaxy evolution, we investigate whether the incidence of ionized outflows in AGNs varies depending on the environment where they reside. We make use of a large sample of AGNs selected from the Sloan Digital Sky Survey (SDSS) Data Release 13 (DR13; Albareti et al. 2017) in combination with the group catalogue from Lim et al. (2017). We note that although the SDSS survey does not cover the more crowded regions of galaxy clusters, due to fibre collisions (e.g., Gavazzi et al. 2011), it includes galaxies in groups and clusters where environmental effects have been shown to be at play (e.g., Balogh et al. 2004; Pimbblet et al. 2013), leading to the appearance of the jellyfish feature (Roberts et al. 2021; Kolcu et al. 2022).
In Sect. 2, we explain the selection of the AGN sample from SDSS DR13 and the definition of environmental parameters. In Sect. 3, we describe the spectral identification of ionized outflows. Section 4 contains the study of the incidence of ionized outflows in galaxies residing in different environments. Section 5 includes a discussion of the results, and in Sect. 6 we present the summary and main conclusions of our work. Throughout this work, we adopt a cosmology with H0 = 67.3 km s−1 Mpc−1, ΩM = 0.315, and ΩΛ = 0.685 (Planck Collaboration XVI 2014). The 1σ binomial uncertainties for the fractions presented in this paper were calculated following Cameron (2011).
2. Data
2.1. Parent SDSS DR13
For this work we used the spectroscopic data from the SDSS DR 13 (Albareti et al. 2017), which is built on previous releases but has significant improvements, such as a better photometric calibration and measured redshifts for some of the fibre collision galaxies. The survey is complete to an extinction corrected Petrosian magnitude of 17.77 mag in the r band. In addition to the spectroscopic data, we used the set of MPA-JHU Value Added Catalogues12 that provide the main properties of the galaxies derived from the analysis of the SDSS photometric and spectroscopic data based on the methods of Kauffmann et al. (2003), Brinchmann et al. (2004), and Tremonti et al. (2004), such as redshifts, emission line fluxes, equivalent widths, and total stellar masses. The provided emission line measurements were obtained after careful modelling and subtraction of the stellar continuum. Stellar masses were derived by fitting of SDSS photometry as described in Kauffmann et al. (2003). In our work, we only include galaxies with reliable line measurements and physical parameters (‘RELIABLE’ = 1 in the MPA-JHU catalogues). In order to reduce the effects from redshift incompleteness, we restricted our analysis to galaxies with stellar masses greater than 109 M⊙ and with z < 0.08, which is the redshift at which the number of galaxies in the selected stellar mass range starts to decrease. The physical sizes encompassed by the three-arcsec diameter SDSS fibres range from 0.6 kpc at z ∼ 0.01 to 4.7 kpc at z ∼ 0.08.
2.2. Active galactic nuclei selection
The galaxies hosting an AGN were selected using the standard optical line diagnostic BPT diagram (Baldwin et al. 1981) that employs the ratios between the [O III] λ5007/Hβ and [N II] λ6584/Hα emission lines. Considering only the spectra where these four emission lines are detected with a signal-to-noise ratio (S/N) greater than three, we selected as AGN hosts the galaxies whose line ratios correspond to regions in the diagnostic diagram above the demarcation line from Kewley et al. (2001), where theoretical models require the presence of nuclear activity to explain the ionization state of the gas. Additionally, we selected only strong AGN cases by using the separation line between Seyfert and LINERs, as suggested by Cid Fernandes et al. (2010), and required a minimum EW(Hα) of 1.5 Å. The application of these criteria implies that the [O III] λ5007 line is detected with S/N ⪆ 10 and led to a sample of approximately 3300 optically selected AGNs.
We note that this selection includes both Type 1 and Type 2 AGNs. However, since the line fluxes provided by the MPA-JHU Value Added Catalogues correspond to measurements using a single kinematic component, some Type 1 AGNs may have been missed by our selection since the emission from the broad-line region might have led to higher Hβ and Hα fluxes and, as a consequence, to lower values of the [N II] λ6584]/Hα and [O III] λ5007/Hβ line ratios, placing them below the Kewley et al. (2001) demarcation line. However, we note that this effect does not lead to contamination in our selected sample from non-AGN galaxies, keeping our AGN selection pure though not complete.
2.3. Environmental parameters
To probe the environment where AGNs reside, we used the group catalogue from Lim et al. (2017), which provides the results from applying the SDSS DR13 data to a halo-based group finder built on the methods developed in Yang et al. (2005, 2007) and Lu et al. (2016) but with an improved halo mass assignment. From this catalogue, we made use of the classification of galaxies into centrals (corresponding to either isolated galaxies or the most massive member of a group) and other group members, the number of galaxies in a group and the halo masses of groups assigned using abundance matching. We used halo mass estimates that consider galaxy stellar mass as a proxy and included only galaxy groups with halo masses that are complete at their corresponding redshifts.
We further explored environmental effects using two parameters: (1) the projected surface density to the fifth neighbour around each AGN, δ5, considering only galaxies within ±Δzc = 1000 km s−1 and (2), for satellites, the projected distance to the central galaxy, rcen, normalized by r180, the radius of the halo within which the mean mass density is 180 times the mean density of the universe at the given redshift, obtained using Eq. (4) from Lim et al. (2017). Both parameters have been widely used to trace environmental changes in galaxies, with δ5 being used to probe the local environment around the AGNs (e.g., Dressler 1980; Balogh et al. 2004; Croom et al. 2021) and rcen providing information on the influence of the intra-group or ICM (which become denser at shorter distances) and the time since the galaxy entered the group environment (e.g., Bamford et al. 2009; Jaffé et al. 2011).
Since we wanted to focus only on the effects that the environment might have on the incidence of ionized outflows, we needed to avoid including galaxies that might be interacting with other objects via mergers. To this end, we used the visual morphological classification of SDSS galaxies carried out by the Galaxy Zoo project (Lintott et al. 2008, 2011), as it provides an estimate based on the fraction of votes assigned by the classifiers of whether a galaxy might be associated with a merger event. Darg et al. (2010) performed a refined merger classification based on the Galaxy Zoo results for galaxies with redshifts 0.005 < z < 0.1, finding that cases with a weighted-merger-vote fraction (fm) ≳ 0.6 are generally robust mergers, whereas misclassifications start to be common for fm ≲ 0.4. To make a conservative removal of merger candidates, we discarded from our sample all galaxies classified as mergers by Darg et al. (2010), and for those outside their classified redshift range, we discarded the galaxies with fm ≥ 0.4. In total we removed from our study 46 potential mergers (less than 1.5% of the sample).
To work with a sample of AGNs that are likely undergoing environmental effects, we defined a ‘satellite’ sample as containing AGNs that reside in groups of at least five members (as in e.g., Roberts et al. 2021). Additionally, we defined the ‘isolated’ sample as comprising the AGNs with no group assignment and that reside in regions where δ5 is within the lowest quintile of the sample. The central galaxies of the groups are not included in the satellite sample. Being the most massive, central galaxies are not expected to undergo strong interactions with the dense intra-group or ICM. The satellite and isolated samples contain approximately 500 and 350 AGNs, respectively. The distribution of halo masses for the selected population of satellite AGNs is shown in Fig. 1, ranging from ∼1012 to 1015 M⊙ and with more than 75% of the AGNs residing in groups of halo masses greater than 1013 M⊙. We note that the approximately 2500 AGNs not fulfilling our isolated and satellite definitions are still considered in this study as part of the full AGN sample.
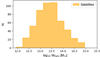 |
Fig. 1. Distribution of group halo masses for the selected sample of satellite AGNs. (See Sect. 2.3). |
3. Modelling of the gas kinematics and outflow identification
To evaluate the presence of ionized outflows in our AGN sample, we used the [O III] λ5007 emission line because, as a forbidden line, its velocity profile is not affected by the high velocities associated with the dense broad-line region in Type 1 AGNs. Instead, it traces the low-density ionized gas from the narrow-line region around the AGNs and from the galaxy. Thus, a broadening of the [O III] λ5007 emission would necessarily be a consequence of the presence of an additional ionized gas component moving at velocities different from the systemic one, allowing for the detection, for instance, of galactic outflows. Furthermore, [O III] λ5007 is generally less affected by nearby emission or absorption lines that could hamper its spectral modelling (as happens with Hα and the neighbouring [N II] λλ6548,6584 lines)3.
Before modelling the [O III] λ5007 emission line, we subtracted the contribution of the stellar populations from the spectra of the galaxies. The stellar continuum fitting was performed with the software Penalized Pixel-Fitting (pPXF; Cappellari 2017) using as templates the PEGASE-HR simple stellar population models (Le Borgne et al. 2004) that have the appropriate spectral resolution (Full Width at Half Maximum (FWHM) ∼0.5 Å) and wavelength coverage (3900–6800 Å) to fit the SDSS spectra.
To reproduce the velocity distribution of the ionized gas, we performed separate fits of the [O III] λ5007 emission line using two different models with one and two kinematic components (narrow and broad), respectively, that are described as Gaussian functions. From our sample, we removed the spectra (< 4%) affected by bad pixels within ±5σ of the narrow or broad components of the [O III] λ5007 line. The two-component model is a better representation of the data based on the goodness of the fit, which was evaluated through the reduced χ2 and the Bayesian information criterion statistics (Schwarz 1978). We considered that an AGN hosts a candidate ionized outflow when the spectral fitting favours a model with a kinematic component (either the one from the single-component fit or the broad component in the two-component fit) with a peak of emission at least three times larger than the standard deviation in the neighbouring continuum and a velocity dispersion (after deconvolution with the SDSS spectral line-spread function) larger than 200 km s−1.
The adopted value of 200 km s−1 is at least twice the systemic velocity dispersion measured throughout local galaxies within the stellar mass range we cover, approximately 109 − 1011.5 M⊙ (e.g., Green et al. 2010; Yu et al. 2019), indicating that we selected clear cases where the galaxy hosts a secondary gas component following non-gravitational motions, which are potentially associated to a galactic outflow. A similar kinematic criterion has been widely used to identify ionized outflows in other works (e.g., Ho et al. 2014; Woo et al. 2016; Gallagher et al. 2019; Förster Schreiber et al. 2019; Rodríguez del Pino et al. 2019). As an example, Fig. 2 contains the spectra of two galaxies where a model with two kinematic components is preferred but only one of them hosts an ionized outflow following our selection criteria.
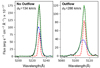 |
Fig. 2. Example of the modelling of the gas kinematics through the [O III] λ5007 line for two AGNs of our sample. In both spectra, a broad component (blue) is identified in addition to a narrow one (red). However, only the spectra shown on the right panel, with σbroad > 200 km s−1, is considered consistent with the presence of an ionized outflow following our identification criteria (see Sect. 3). |
4. Incidence of ionized outflows in AGNs as a function of environment
4.1. Outflow incidence
By applying the selection criteria described in the previous section to our sample of AGNs, we found that 24% of them (approximately 800) host an ionized outflow. This global incidence value is very similar to the 25% reported by Wylezalek et al. (2020) in the MaNGA-selected sample of local AGN, where they also used the [O III] λ5007 to trace outflows. However, our value is lower than the one reported in Rodríguez del Pino et al. (2019), where they detected ionized outflows through Hα emission in 41% of their AGNs, although this discrepancy could be due to their significantly lower sample of AGNs (approximately 30) and a more relaxed criterion to identify outflows. Other works have found the fraction of outflows in AGNs to be always larger than in sources with different types of ionization (star formation, LIERs) and with detections rates varying between 10% and 70% as a function of AGN luminosity (Woo et al. 2016; Avery et al. 2021; Matzko et al. 2022). Finally, given that our selection criteria (Sect. 2.2) might miss some Type 1 AGNs and these AGNs generally show higher incidence than Type 2 (Perna et al. 2017; Rojas et al. 2020), the outflow fractions we obtained should be considered as lower limits.
In the following sections, we explore whether the incidence of outflows is affected by the environment where galaxies reside. This is done by studying its variation as a function of the environmental tracers described in Sect. 2.3.
4.2. Isolated and satellite AGNs
We started by evaluating the fraction of ionized outflows in isolated and satellite AGNs as a function of two main galaxy parameters: the stellar mass and the [O III] luminosity (L[O III]; estimated using the total flux in the [O III] λ5007 line obtained in the spectral modelling described in Sect. 3). Controlling by stellar mass is important because environmental effects are expected to have different impacts on galaxies depending on their stellar masses (Kuchner et al. 2017; Rodríguez del Pino et al. 2017; Papovich et al. 2018), and the incidence of AGNs in jellyfish galaxies is considered to be higher in more massive systems (Peluso et al. 2022). Furthermore, since AGN accretion rate is known to drive powerful gas flows into the host (King & Pounds 2015), leading to the positive correlation between the incidence of outflows and AGN luminosity traced by L[O III] (e.g., Wylezalek et al. 2020), we also needed to perform the comparison between isolated and satellite AGNs, accounting for possible differences in L[O III] between the two samples. Figure 3 contains the fraction of outflows in both AGN samples as a function of stellar mass (left panel) and L[O III] (right panel). The results presented in the left panel of this figure indicate that isolated AGNs host a roughly uniform fraction of outflows (∼23%) throughout the stellar mass range covered in our study. In contrast, the AGN satellites display a clear trend of an increasing fraction of outflows towards more massive systems, ranging from approximately 7% in the lower-mass bins to 32% in galaxies with masses above 1010.7 M⊙. With the exception of the highest-mass bin, the outflow incidence is generally higher in isolated AGNs than in satellites, especially at masses below 1010.3 M⊙ where the incidence is up to three times higher. At the highest-mass bin the outflow incidence in satellites seems slightly higher than in isolated ones, although the fractions are consistent within the 1σ errors. With respect to the variation as a function of L[O III], as shown in the right panel of Fig. 3, the incidence of outflows in both AGN populations steeply increases from less than 5% at the lowest luminosities (< 1039 erg s−1) to > 45% in the more luminous systems (> 1041 erg s−1). Interestingly, within a given L[O III] bin the difference between the incidence of outflows in isolated and satellite AGN is not significant, with the fractions in both populations being consistent among them within the 1σ errors.
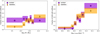 |
Fig. 3. Fraction of outflows for isolated and satellite AGNs. Left panel: outflows as a function of stellar mass. Right panel: outflows as a function of L[O III]. The heights of the boxes denote the 1σ errors associated with the fractions. Bins were defined to include at least 50 galaxies each. |
The steeper increase in the incidence of outflows as a function of L[O III] together with the similar fractions obtained for isolated and satellite AGNs within a given luminosity bin indicate that L[O III] is more strongly connected to the presence of ionized outflows than stellar mass. Given the more dominant correlation with L[O III], the differences in the fraction of outflows observed at lower masses between isolated and satellite AGNs might be related to a difference in L[O III]. We explored this possibility in Fig. 4 by comparing the L[O III] values for isolated and satellite AGNs in different stellar mass bins. At low stellar masses (≲1010.1 M⊙), the average luminosities of the two samples differ by more than 0.3 dex, but this difference shrinks gradually when moving towards higher stellar masses, with both populations displaying practically equal L[O III] distributions (mean values and standard deviation) in the more massive systems. These results demonstrate that the lower incidence of outflows in lower-mass satellite AGNs is due to their lower L[O III] compared to that of isolated AGNs. Therefore, lower-mass satellite AGNs must follow a different evolutionary path, undergoing processes that have a stronger influence at lower masses leading to a lower L[O III] and consequently to a lower accretion rate, reducing the probability of hosting an ionized outflow.
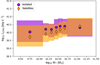 |
Fig. 4. Average L[O III] in different stellar mass bins for isolated and satellite AGNs. Bottom and top values of the boxes denote the 16th and 84th percentiles of the L[O III] distributions in each bin. Bins were defined to include at least 50 galaxies each. |
To further explore the possible environmental influence on the incidence of outflows in satellite AGNs, we studied its variation as a function of the normalized distance to the central galaxy of each group, rcen/r180 (see Sect. 2.3). This is presented in the left panel of Fig. 5 where the satellite population has been split into two samples by 1010.3 M⊙ (the stellar mass below which satellite AGNs display a lower incidence of outflows) to study the lower- and higher-mass regimes separately. The lower- and higher-mass satellite populations display similar trends with rcen/r180, presenting lower fractions (∼5% and ∼16 − 22%, respectively) at the distances closest to the central galaxy than at greater distances (∼13 − 18% and ∼27 − 33%, respectively). As expected, the higher-mass sample always has a higher fraction of outflows (≥0.1 dex) than the lower-mass sample. This result indicates that the processes responsible for the reduction in the incidence of outflows in satellite AGNs should become more efficient in the proximity to the centre of the group or cluster.
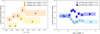 |
Fig. 5. Fraction of outflows in AGN as a function of environmental parameters. Left panel: outflows as a function of the normalized distance to the central galaxy of the group, rcen/r180, for AGN satellites. Right panel: outflows as a function of the projected surface density to the nearest 5th neighbour, δ5, for all the AGNs in our sample. In both cases, we divided the sample by lower and higher mass. The heights of the boxes denote the 1σ errors associated with the fractions. Bins were defined to include at least 40 (left) and 100 (right) galaxies, respectively. |
4.3. Local surface density
Another way of exploring environmental effects is by probing the local environment around AGNs. In our case, this was done through the projected surface density to the fifth neighbour, δ5 (see Sect. 2.3). A high value of δ5 might imply proximity between galaxies, favouring processes such as galaxy-galaxy harassment (Moore et al. 1996), and the presence of local inhomogeneities in the density of galaxies and/or associated intra-group or intra-cumular material that could lead to ram-pressure stripping. Therefore, a high value of δ5 does not necessarily imply low rcen since there can be groups of several (five or more) galaxies accreted by the cluster but still far from the centre, leading to a ‘pre-processing’ effect (Fujita 2004; Darvish et al. 2015). As in the previous section, to evaluate the influence of δ5 on the incidence of outflows, we defined the lower- and higher-mass samples by using 1010.3 M⊙ as the dividing line, in this case, for the full sample of AGNs. The fraction of ionized outflows in the lower- and higher-mass samples of AGN as a function of local surface density are shown in the right panel of Fig. 5. The two samples clearly display different trends: On the one hand, higher-mass AGNs have a mean outflow incidence of 27% across all densities, with some bins having fractions of 23% (lowest δ5 bin) and 34% (intermediate δ5 bins). On the other hand, the low-mass AGNs experience a clear decline in the fraction of outflows when moving towards denser regions, decreasing from approximately 25% at low densities to approximately 13% at high densities. At high densities, the fraction of outflows in higher-mass AGNs is twice as high. The similar incidence of outflows at low densities and the observed diverging trends indicate that an increase in local density affects AGNs with lower stellar masses more strongly, significantly reducing their probability of hosting ionized outflows.
5. Discussion
5.1. Environmental reduction of outflows in AGNs
The observed decline in the incidence of ionized outflows in low-mass satellite AGNs (M⊙ < 1010.3 M⊙) together with the declining fractions at distances closer to the central galaxy of the group or cluster and towards locally denser regions indicate that environment plays a role in the likelihood of AGNs hosting ionized outflows. Given that the triggering of AGN activity and ionized outflows depend on the availability of gas to act as fuel, it is reasonable to expect that the environmental processes responsible for a variation in the AGN fraction might also drive a change in the fractions of outflows in AGNs. In this regard, previous works have associated the decline of AGN activity in clusters to two main drivers: a decrease in the merger rate due to higher relative velocities of galaxies in clusters (i.e. Popesso & Biviano 2006) and the stripping of gas from systems by the dense intergalactic medium, which prevents the feeding of the SMBH (Sabater et al. 2013; Coldwell et al. 2014). In support of the relevance of the merger rate as a driver, Duplancic et al. (2021) found that the fraction of AGNs in galaxy groups is always lower than in galaxy pairs and triplets, where AGNs also tend to be more energetic. However, as noted by Matzko et al. (2022), for a given AGN luminosity, galaxies undergoing mergers or interactions might not necessarily have a higher incidence of outflows than galaxies in isolation. Therefore, an increase in the incidence of outflows for interacting systems would only be expected if the interaction leads to an increase in luminosity. In our work, we have removed potential merger candidates (see Sect. 2.3) in order to minimize their influence on the incidence of outflows in AGNs and focus on environmental effects. However, if additional galaxy-galaxy interactions (not classified as mergers) that could trigger AGN activity and a subsequent outflow were present in our sample and favoured at lower densities (e.g., Alonso et al. 2012), they could help explain the decline in the incidence of outflows for the lower-mass AGNs when moving towards locally higher densities, though they would not explain the roughly constant incidence of outflows in higher-mass AGNs.
In the case where galaxies experience gas stripping, there would be less fuel available to feed the SMBH, and consequently, the AGN luminosity, which is powered by accretion, should decrease. Since we identified a decline in the fraction of outflows as a function of decreasing distance to the central galaxy and an increase in local density (Fig. 5), we explored the variation of L[O III] as a function of these environmental parameters. In Fig. 6, we show the total L[O III] as a function of rcen/r180 for AGN satellites and δ5 for all AGN in our sample. In both cases, we split the samples into lower- and higher-mass galaxies by using 1010.3 M⊙.
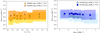 |
Fig. 6. Average L[O III] for AGN as a function of environmental parameters. Left panel: L[O III] in bins of normalized distance to the central galaxy of the group, rcen/r180, for AGN satellites. Right panel: L[O III] in bins of projected surface density to the nearest 5th neighbour, δ5, for all the AGNs in our sample, split into lower- and higher-mass samples. Bottom and top values of the boxes denote the 16th and 84th percentiles of the L[O III] distributions in each bin. Bins in each plot were defined to include at least 25 (left) and 100 galaxies (right) galaxies, respectively. |
The left panel of Fig. 6 shows an increase in the L[O III] with rcen/r180 for the lower-mass sample, whereas the higher-mass sample displays relatively constant L[O III] distributions. A Spearman’s correlation test for the lower-mass sample yielded an associated coefficient ρ = 0.14, with a p-value of less than 0.02, although the scatter is quite large, as indicated by the 16th and 84th percentiles (height of the boxes in Fig. 6). We observed a similar decrease in total L[O III] for the lower-mass sample towards regions of higher local density (right panel of Fig. 6). In this case, the correlation seems more significant (ρ = −0.17; p-value < 1 × 10⁻⁶), although the scatter is again quite large. Moreover, as expected, the lower-mass AGN populations always have lower L[O III] than the higher-mass AGNs.
These marginal but systematic global trends observed in L[O III] could be an indication that environmental processes affect the gas reservoirs in galaxies, leading to a reduction in the available material to sustain the feeding of the AGN and subsequently reducing the incidence of ionized outflows. A potential mechanism causing this effect would be ram-pressure stripping since it affects only the gas component in the galaxies and its strength increases with density and velocities, which are expected to be high at closer distances to the central galaxy.
The results we obtained are in apparent contrast with the positive connection between ram-pressure stripping and AGN activity suggested by Poggianti et al. (2017a) and Peluso et al. (2022), but they are in better agreement with the low fraction of jellyfish AGNs found in other works, such as Roman-Oliveira et al. (2019) and Kolcu et al. (2022). However, in the comparison between these different works, one must bear in mind two key aspects: the environments and the range of stellar masses probed. For instance, although this study covers environments (see Fig. 1) where ram-pressure stripping has been found to be acting on galaxies and leading to the jellyfish feature (Roberts et al. 2021), SDSS data do no cover the more crowded regions of galaxy clusters (e.g., Gavazzi et al. 2011) that probably host the most extreme jellyfish cases, such as those studied in Poggianti et al. (2017a). Moreover, in Poggianti et al. (2017a), they selected only very massive galaxies (4 × 10¹⁰ − 3 × 10¹¹ M⊙), whereas in this work we consider AGNs with a much wider range of stellar masses, especially at the lower-mass end. Therefore, the relative role of the environmental processes at different density regimes acting on galaxies with different stellar masses could explain the observed behaviours in previous works.
5.2. Impact on the regulation of metal content
The important role that outflows are believed to play in the regulation of the metal content in galaxies implies that the lower fraction of ionized outflows in the lower-mass satellite AGNs found in this work might also alter the gas metallicity of their corresponding galaxies. In fact, a lower incidence of outflows will reduce the amount of gas that is expelled out of lower-mass systems, allowing future star formation episodes that can enrich the metal content of their interstellar medium. As a consequence, these lower-mass satellite systems might not reduce their metallicities, contrary to those residing in lower-density environments (i.e. field galaxies) where the higher incidence of outflows will lead to their expected lower metallicities, following the well-known relation between stellar mass and gas metallicity (Tremonti et al. 2004; Mannucci et al. 2010; Dayal et al. 2013; Chisholm et al. 2018).
Although an average increase in metallicity for galaxies residing in denser environments has already been reported in several works (Aracil et al. 2006; Cooper et al. 2008; Ellison et al. 2009; Darvish et al. 2015; Schaefer et al. 2019), our findings that such differences are mainly relevant for lower-mass galaxies are supported by the enhanced metal content of low-mass galaxies (108 − 1010 M⊙) in the Coma and A1367 galaxy clusters reported in Petropoulou et al. (2012) and the results from Wu et al. (2017), who reported that the difference in metallicity with the environment in SDSS galaxies was only observed for lower-mass galaxies, displaying a median metallicity systematically higher in denser regions. All the previous studies have associated the higher metallicities of galaxies in denser regions to processes such as the truncation of gas infall or wind re-accretion due to interactions with the ICM and the accretion of metal-rich gas by satellite galaxies. The results obtained in this work indicate that due to the lower incidence of ionized outflows in lower-mass AGNs, their role as metal regulators might be less relevant, thus contributing to the explanation of the higher metallicities of lower-mass galaxies in denser regions.
6. Conclusions
In this work, we have investigated whether environmental effects have an impact on AGN activity by studying the incidence of ionized outflows in a sample of approximately 3300 AGNs drawn from SDSS DR13. Using the [O III] λ5007 emission line as a tracer for the ionized gas we have searched for signatures of ionized outflows, finding them in 24% of the AGNs. We have compared their incidence in isolated and satellite AGNs, and as a function of the projected distance to the central galaxy of the group and the projected surface density to the fifth neighbour. Our main results are:
-
At lower masses (109 − 1010.3 M⊙), the fraction of ionized outflows is significantly lower in satellite AGNs than in isolated AGNs. In satellite AGNs, the incidence increases strongly towards higher masses (from ∼7% to 32%), whereas in the isolated sample, there is no significant variation within the stellar mass range we cover (∼109 − 1011.5 M⊙).
-
The AGN luminosities, L[O III], of isolated AGNs and satellite AGNs differ by more than 0.3 dex at lower masses, but this difference disappears gradually as systems become more massive. The lower fraction of outflows in satellite AGNs at lower masses can be explained by their lower L[O III] compared to those of isolated AGNs with similar stellar masses (previous point) since the incidence is similar for both isolated and satellite AGNs at fixed L[O III].
-
The fraction of lower-mass (109 − 1010.3 M⊙) satellite AGNs hosting ionized outflows declines significantly with projected surface density from about 25% to approximately 13%. The fraction of outflows also decreases at distances closer to the central galaxy of the group or cluster for all satellite AGNs.
-
There is a large scatter in the relation between L[O III] and both the projected distance to the central galaxy and the projected surface density for satellite AGNs. However, for the lower-mass ones (109 − 1010.3 M⊙) there is a tentative indication of a decrease in L[O III] at distances closer to the central galaxy and for denser regions.
Our findings indicate that environmental processes decrease the probability that AGNs host ionized outflows, particularly in less massive systems (109 − 1010.3 M⊙). We interpret this result as being a consequence of the removal of gas reservoirs around these host galaxies due to interactions with the dense intergalactic medium of group and cluster environments. This gas removal and lower incidence of outflows could also explain the lower fraction of AGNs in clusters and the higher gas metallicities of galaxies in clusters compared to field galaxies, especially at lower masses, reported in previous works.
Acknowledgments
B.R.D.P., S.A. and M.P. acknowledge support from the Spanish Ministerio de Economía y Competitividad through the grants PID2019-106280GB-I00 and PID2021-127718NB-I00. A.L.C.S. acknowledges funding from the Conselho Nacional de Desenvolvimento Científico e Tecnológico (CNPq) and the Rio Grande do Sul Research Foundation (FAPERGS) through grant CNPq-314301/2021-6 and FAPERGS/CAPES 19/2551-0000696-9. I.L. acknowledges support from the Spanish Ministry of Science and Innovation (MCIN) by means of the Recovery and Resilience Facility, and the Agencia Estatal de Investigación (AEI) under the projects BDC20221289 and PID2019-105423GA-I00. M.P. acknowledges support from the Programa Atracción de Talento de la Comunidad de Madrid via grant 2018-T2/TIC-11715. Funding for the Sloan Digital Sky Survey IV has been provided by the Alfred P. Sloan Foundation, the U.S. Department of Energy Office of Science, and the Participating Institutions. SDSS-IV acknowledges support and resources from the centre for High-Performance Computing at the University of Utah. The SDSS web site is https://www.sdss.org/. This research made use of Astropy, a community-developed core Python package for Astronomy (Astropy Collaboration 2018). This research has made use of the NASA/IPAC Extragalactic Database (NED) which is operated by the Jet Propulsion Laboratory, California Institute of Technology, under contract with the National Aeronautics and Space Administration.
References
- Albareti, F. D., Prieto, C. A., Almeida, A., et al. 2017, ApJS, 233, 25 [NASA ADS] [CrossRef] [Google Scholar]
- Alonso, S., Mesa, V., Padilla, N., & Lambas, D. G. 2012, A&A, 539, A46 [NASA ADS] [CrossRef] [EDP Sciences] [Google Scholar]
- Aracil, B., Tripp, T. M., Bowen, D. V., et al. 2006, MNRAS, 367, 139 [NASA ADS] [CrossRef] [Google Scholar]
- Arribas, S., Colina, L., Bellocchi, E., Maiolino, R., & Villar-Martín, M. 2014, A&A, 568, A14 [NASA ADS] [CrossRef] [EDP Sciences] [Google Scholar]
- Astropy Collaboration (Price-Whelan, A. M., et al.) 2018, AJ, 156, 123 [Google Scholar]
- Avery, C. R., Wuyts, S., Förster Schreiber, N. M., et al. 2021, MNRAS, 503, 5134 [NASA ADS] [CrossRef] [Google Scholar]
- Baldwin, J. A., Phillips, M. M., & Terlevich, R. 1981, PASP, 93, 5 [Google Scholar]
- Balogh, M., Eke, V., Miller, C., et al. 2004, MNRAS, 348, 1355 [Google Scholar]
- Bamford, S. P., Nichol, R. C., Baldry, I. K., et al. 2009, MNRAS, 393, 1324 [NASA ADS] [CrossRef] [Google Scholar]
- Belfiore, F., Maiolino, R., Maraston, C., et al. 2016, MNRAS, 461, 3111 [Google Scholar]
- Boselli, A., Fossati, M., & Sun, M. 2022, A&ARv, 30, 3 [NASA ADS] [CrossRef] [Google Scholar]
- Brinchmann, J., Charlot, S., White, S. D. M., et al. 2004, MNRAS, 351, 1151 [Google Scholar]
- Cameron, E. 2011, PASA, 28, 128 [Google Scholar]
- Cappellari, M. 2017, MNRAS, 466, 798 [Google Scholar]
- Chisholm, J., Tremonti, C., & Leitherer, C. 2018, MNRAS, 481, 1690 [NASA ADS] [CrossRef] [Google Scholar]
- Cid Fernandes, R., Stasińska, G., Schlickmann, M. S., et al. 2010, MNRAS, 403, 1036 [Google Scholar]
- Coldwell, G. V., Gurovich, S., Díaz Tello, J., Söchting, I. K., & Lambas, D. G. 2014, MNRAS, 437, 1199 [CrossRef] [Google Scholar]
- Cooper, M. C., Tremonti, C. A., Newman, J. A., & Zabludoff, A. I. 2008, MNRAS, 390, 245 [NASA ADS] [CrossRef] [Google Scholar]
- Croom, S. M., Owers, M. S., Scott, N., et al. 2021, MNRAS, 505, 991 [NASA ADS] [CrossRef] [Google Scholar]
- Darg, D. W., Kaviraj, S., Lintott, C. J., et al. 2010, MNRAS, 401, 1043 [NASA ADS] [CrossRef] [Google Scholar]
- Darvish, B., Mobasher, B., Sobral, D., et al. 2015, ApJ, 814, 84 [NASA ADS] [CrossRef] [Google Scholar]
- Dayal, P., Ferrara, A., & Dunlop, J. S. 2013, MNRAS, 430, 2891 [Google Scholar]
- Dressler, A. 1980, ApJ, 236, 351 [Google Scholar]
- Dressler, A., Thompson, I. B., & Shectman, S. A. 1985, ApJ, 288, 481 [NASA ADS] [CrossRef] [Google Scholar]
- Duplancic, F., Lambas, D. G., Alonso, S., & Coldwell, G. V. 2021, MNRAS, 504, 4389 [NASA ADS] [CrossRef] [Google Scholar]
- Ellison, S. L., Simard, L., Cowan, N. B., et al. 2009, MNRAS, 396, 1257 [NASA ADS] [CrossRef] [Google Scholar]
- Fabian, A. C. 2012, ARA&A, 50, 455 [Google Scholar]
- Förster Schreiber, N. M., Übler, H., Davies, R. L., et al. 2019, ApJ, 875, 21 [Google Scholar]
- Fujita, Y. 2004, PASJ, 56, 29 [NASA ADS] [Google Scholar]
- Gallagher, R., Maiolino, R., Belfiore, F., et al. 2019, MNRAS, 485, 3409 [NASA ADS] [CrossRef] [Google Scholar]
- Gavazzi, G., Savorgnan, G., & Fumagalli, M. 2011, A&A, 534, A31 [NASA ADS] [CrossRef] [EDP Sciences] [Google Scholar]
- George, K., Poggianti, B. M., Bellhouse, C., et al. 2019, MNRAS, 487, 3102 [Google Scholar]
- Gisler, G. R. 1978, MNRAS, 183, 633 [NASA ADS] [CrossRef] [Google Scholar]
- Green, A. W., Glazebrook, K., McGregor, P. J., et al. 2010, Nature, 467, 684 [NASA ADS] [CrossRef] [Google Scholar]
- Gunn, J. E., & Gott, J. R., III 1972, ApJ, 176, 1 [Google Scholar]
- Ho, I.-T., Kewley, L. J., Dopita, M. A., et al. 2014, MNRAS, 444, 3894 [CrossRef] [Google Scholar]
- Jaffé, Y. L., Aragón-Salamanca, A., Kuntschner, H., et al. 2011, MNRAS, 417, 1996 [Google Scholar]
- Joshi, G. D., Pillepich, A., Nelson, D., et al. 2020, MNRAS, 496, 2673 [Google Scholar]
- Kauffmann, G., Heckman, T. M., White, S. D. M., et al. 2003, MNRAS, 341, 33 [Google Scholar]
- Kewley, L. J., Dopita, M. A., Sutherland, R. S., Heisler, C. A., & Trevena, J. 2001, ApJ, 556, 121 [Google Scholar]
- King, A., & Pounds, K. 2015, ARA&A, 53, 115 [NASA ADS] [CrossRef] [Google Scholar]
- Kolcu, T., Crossett, J. P., Bellhouse, C., & McGee, S. 2022, MNRAS, 515, 5877 [CrossRef] [Google Scholar]
- Kormendy, J., & Ho, L. C. 2013, ARA&A, 51, 511 [Google Scholar]
- Kuchner, U., Ziegler, B., Verdugo, M., Bamford, S., & Häußler, B. 2017, A&A, 604, A54 [NASA ADS] [CrossRef] [EDP Sciences] [Google Scholar]
- Larson, R. B., Tinsley, B. M., & Caldwell, C. N. 1980, ApJ, 237, 692 [Google Scholar]
- Le Borgne, D., Rocca-Volmerange, B., Prugniel, P., et al. 2004, A&A, 425, 881 [CrossRef] [EDP Sciences] [Google Scholar]
- Lim, S. H., Mo, H. J., Lu, Y., Wang, H., & Yang, X. 2017, MNRAS, 470, 2982 [NASA ADS] [CrossRef] [Google Scholar]
- Lintott, C. J., Schawinski, K., Slosar, A., et al. 2008, MNRAS, 389, 1179 [NASA ADS] [CrossRef] [Google Scholar]
- Lintott, C., Schawinski, K., Bamford, S., et al. 2011, MNRAS, 410, 166 [Google Scholar]
- Lopes, P. A. A., Ribeiro, A. L. B., & Rembold, S. B. 2017, MNRAS, 472, 409 [NASA ADS] [CrossRef] [Google Scholar]
- Lu, Y., Yang, X., Shi, F., et al. 2016, ApJ, 832, 39 [NASA ADS] [CrossRef] [Google Scholar]
- Mannucci, F., Cresci, G., Maiolino, R., Marconi, A., & Gnerucci, A. 2010, MNRAS, 408, 2115 [NASA ADS] [CrossRef] [Google Scholar]
- Marshall, M. A., Shabala, S. S., Krause, M. G. H., et al. 2018, MNRAS, 474, 3615 [NASA ADS] [CrossRef] [Google Scholar]
- Martig, M., & Bournaud, F. 2008, MNRAS, 385, L38 [NASA ADS] [Google Scholar]
- Martini, P., Kelson, D. D., Kim, E., Mulchaey, J. S., & Athey, A. A. 2006, ApJ, 644, 116 [NASA ADS] [CrossRef] [Google Scholar]
- Matzko, W., Satyapal, S., Ellison, S. L., et al. 2022, MNRAS, 514, 4828 [NASA ADS] [CrossRef] [Google Scholar]
- McGee, S. L., Bower, R. G., & Balogh, M. L. 2014, MNRAS, 442, L105 [Google Scholar]
- Miller, C. J., Nichol, R. C., Gómez, P. L., Hopkins, A. M., & Bernardi, M. 2003, ApJ, 597, 142 [NASA ADS] [CrossRef] [Google Scholar]
- Moore, B., Katz, N., Lake, G., Dressler, A., & Oemler, A. 1996, Nature, 379, 613 [Google Scholar]
- Papovich, C., Kawinwanichakij, L., Quadri, R. F., et al. 2018, ApJ, 854, 30 [NASA ADS] [CrossRef] [Google Scholar]
- Peluso, G., Vulcani, B., Poggianti, B. M., et al. 2022, ApJ, 927, 130 [NASA ADS] [CrossRef] [Google Scholar]
- Perna, M., Lanzuisi, G., Brusa, M., Mignoli, M., & Cresci, G. 2017, A&A, 603, A99 [NASA ADS] [CrossRef] [EDP Sciences] [Google Scholar]
- Petropoulou, V., Vílchez, J., & Iglesias-Páramo, J. 2012, ApJ, 749, 133 [NASA ADS] [CrossRef] [Google Scholar]
- Pimbblet, K. A., Shabala, S. S., Haines, C. P., Fraser-McKelvie, A., & Floyd, D. J. E. 2013, MNRAS, 429, 1827 [NASA ADS] [CrossRef] [Google Scholar]
- Planck Collaboration XVI. 2014, A&A, 571, A16 [NASA ADS] [CrossRef] [EDP Sciences] [Google Scholar]
- Poggianti, B. M., Jaffé, Y. L., Moretti, A., et al. 2017a, Nature, 548, 304 [Google Scholar]
- Poggianti, B. M., Moretti, A., Gullieuszik, M., et al. 2017b, ApJ, 844, 48 [Google Scholar]
- Popesso, P., & Biviano, A. 2006, A&A, 460, L23 [NASA ADS] [CrossRef] [EDP Sciences] [Google Scholar]
- Radovich, M., Poggianti, B., Jaffé, Y. L., et al. 2019, MNRAS, 486, 486 [Google Scholar]
- Ricarte, A., Tremmel, M., Natarajan, P., & Quinn, T. 2020, ApJ, 895, L8 [NASA ADS] [CrossRef] [Google Scholar]
- Roberts, I. D., van Weeren, R. J., McGee, S. L., et al. 2021, A&A, 652, A153 [NASA ADS] [CrossRef] [EDP Sciences] [Google Scholar]
- Rodríguez del Pino, B., Aragón-Salamanca, A., Chies-Santos, A. L., et al. 2017, MNRAS, 467, 4200 [NASA ADS] [Google Scholar]
- Rodríguez del Pino, B., Arribas, S., Piqueras López, J., Villar-Martín, M., & Colina, L. 2019, MNRAS, 486, 344 [CrossRef] [Google Scholar]
- Rojas, A. F., Sani, E., Gavignaud, I., et al. 2020, MNRAS, 491, 5867 [Google Scholar]
- Roman-Oliveira, F. V., Chies-Santos, A. L., Rodríguez del Pino, B., et al. 2019, MNRAS, 484, 892 [Google Scholar]
- Sabater, J., Best, P. N., & Argudo-Fernández, M. 2013, MNRAS, 430, 638 [Google Scholar]
- Schaefer, A. L., Tremonti, C., Pace, Z., et al. 2019, ApJ, 884, 156 [Google Scholar]
- Schulz, S., & Struck, C. 2001, MNRAS, 328, 185 [NASA ADS] [CrossRef] [Google Scholar]
- Schwarz, G. 1978, Ann. Stat., 6, 461 [Google Scholar]
- Singh, R., van de Ven, G., Jahnke, K., et al. 2013, A&A, 558, A43 [NASA ADS] [CrossRef] [EDP Sciences] [Google Scholar]
- Tonnesen, S., & Bryan, G. L. 2009, ApJ, 694, 789 [NASA ADS] [CrossRef] [Google Scholar]
- Tonnesen, S., & Bryan, G. L. 2012, MNRAS, 422, 1609 [CrossRef] [Google Scholar]
- Tremonti, C. A., Heckman, T. M., Kauffmann, G., et al. 2004, ApJ, 613, 898 [Google Scholar]
- Trussler, J., Maiolino, R., Maraston, C., et al. 2020, MNRAS, 491, 5406 [Google Scholar]
- Van Den Bosch, F. C., Aquino, D., Yang, X., et al. 2008, MNRAS, 387, 79 [Google Scholar]
- Woo, J.-H., Bae, H.-J., Son, D., & Karouzos, M. 2016, ApJ, 817, 108 [Google Scholar]
- Wu, P.-F., Zahid, H. J., Hwang, H. S., & Geller, M. J. 2017, MNRAS, 468, 1881 [NASA ADS] [CrossRef] [Google Scholar]
- Wylezalek, D., Flores, A. M., Zakamska, N. L., Greene, J. E., & Riffel, R. A. 2020, MNRAS, 492, 4680 [NASA ADS] [CrossRef] [Google Scholar]
- Yang, X., Mo, H. J., van den Bosch, F. C., & Jing, Y. P. 2005, MNRAS, 356, 1293 [Google Scholar]
- Yang, X., Mo, H. J., van den Bosch, F. C., et al. 2007, ApJ, 671, 153 [Google Scholar]
- Yu, X., Shi, Y., Chen, Y., et al. 2019, MNRAS, 486, 4463 [Google Scholar]
All Figures
|
Fig. 1. Distribution of group halo masses for the selected sample of satellite AGNs. (See Sect. 2.3). |
| In the text | |
|
Fig. 2. Example of the modelling of the gas kinematics through the [O III] λ5007 line for two AGNs of our sample. In both spectra, a broad component (blue) is identified in addition to a narrow one (red). However, only the spectra shown on the right panel, with σbroad > 200 km s−1, is considered consistent with the presence of an ionized outflow following our identification criteria (see Sect. 3). |
| In the text | |
|
Fig. 3. Fraction of outflows for isolated and satellite AGNs. Left panel: outflows as a function of stellar mass. Right panel: outflows as a function of L[O III]. The heights of the boxes denote the 1σ errors associated with the fractions. Bins were defined to include at least 50 galaxies each. |
| In the text | |
|
Fig. 4. Average L[O III] in different stellar mass bins for isolated and satellite AGNs. Bottom and top values of the boxes denote the 16th and 84th percentiles of the L[O III] distributions in each bin. Bins were defined to include at least 50 galaxies each. |
| In the text | |
|
Fig. 5. Fraction of outflows in AGN as a function of environmental parameters. Left panel: outflows as a function of the normalized distance to the central galaxy of the group, rcen/r180, for AGN satellites. Right panel: outflows as a function of the projected surface density to the nearest 5th neighbour, δ5, for all the AGNs in our sample. In both cases, we divided the sample by lower and higher mass. The heights of the boxes denote the 1σ errors associated with the fractions. Bins were defined to include at least 40 (left) and 100 (right) galaxies, respectively. |
| In the text | |
|
Fig. 6. Average L[O III] for AGN as a function of environmental parameters. Left panel: L[O III] in bins of normalized distance to the central galaxy of the group, rcen/r180, for AGN satellites. Right panel: L[O III] in bins of projected surface density to the nearest 5th neighbour, δ5, for all the AGNs in our sample, split into lower- and higher-mass samples. Bottom and top values of the boxes denote the 16th and 84th percentiles of the L[O III] distributions in each bin. Bins in each plot were defined to include at least 25 (left) and 100 galaxies (right) galaxies, respectively. |
| In the text | |
Current usage metrics show cumulative count of Article Views (full-text article views including HTML views, PDF and ePub downloads, according to the available data) and Abstracts Views on Vision4Press platform.
Data correspond to usage on the plateform after 2015. The current usage metrics is available 48-96 hours after online publication and is updated daily on week days.
Initial download of the metrics may take a while.