Fig. 4.
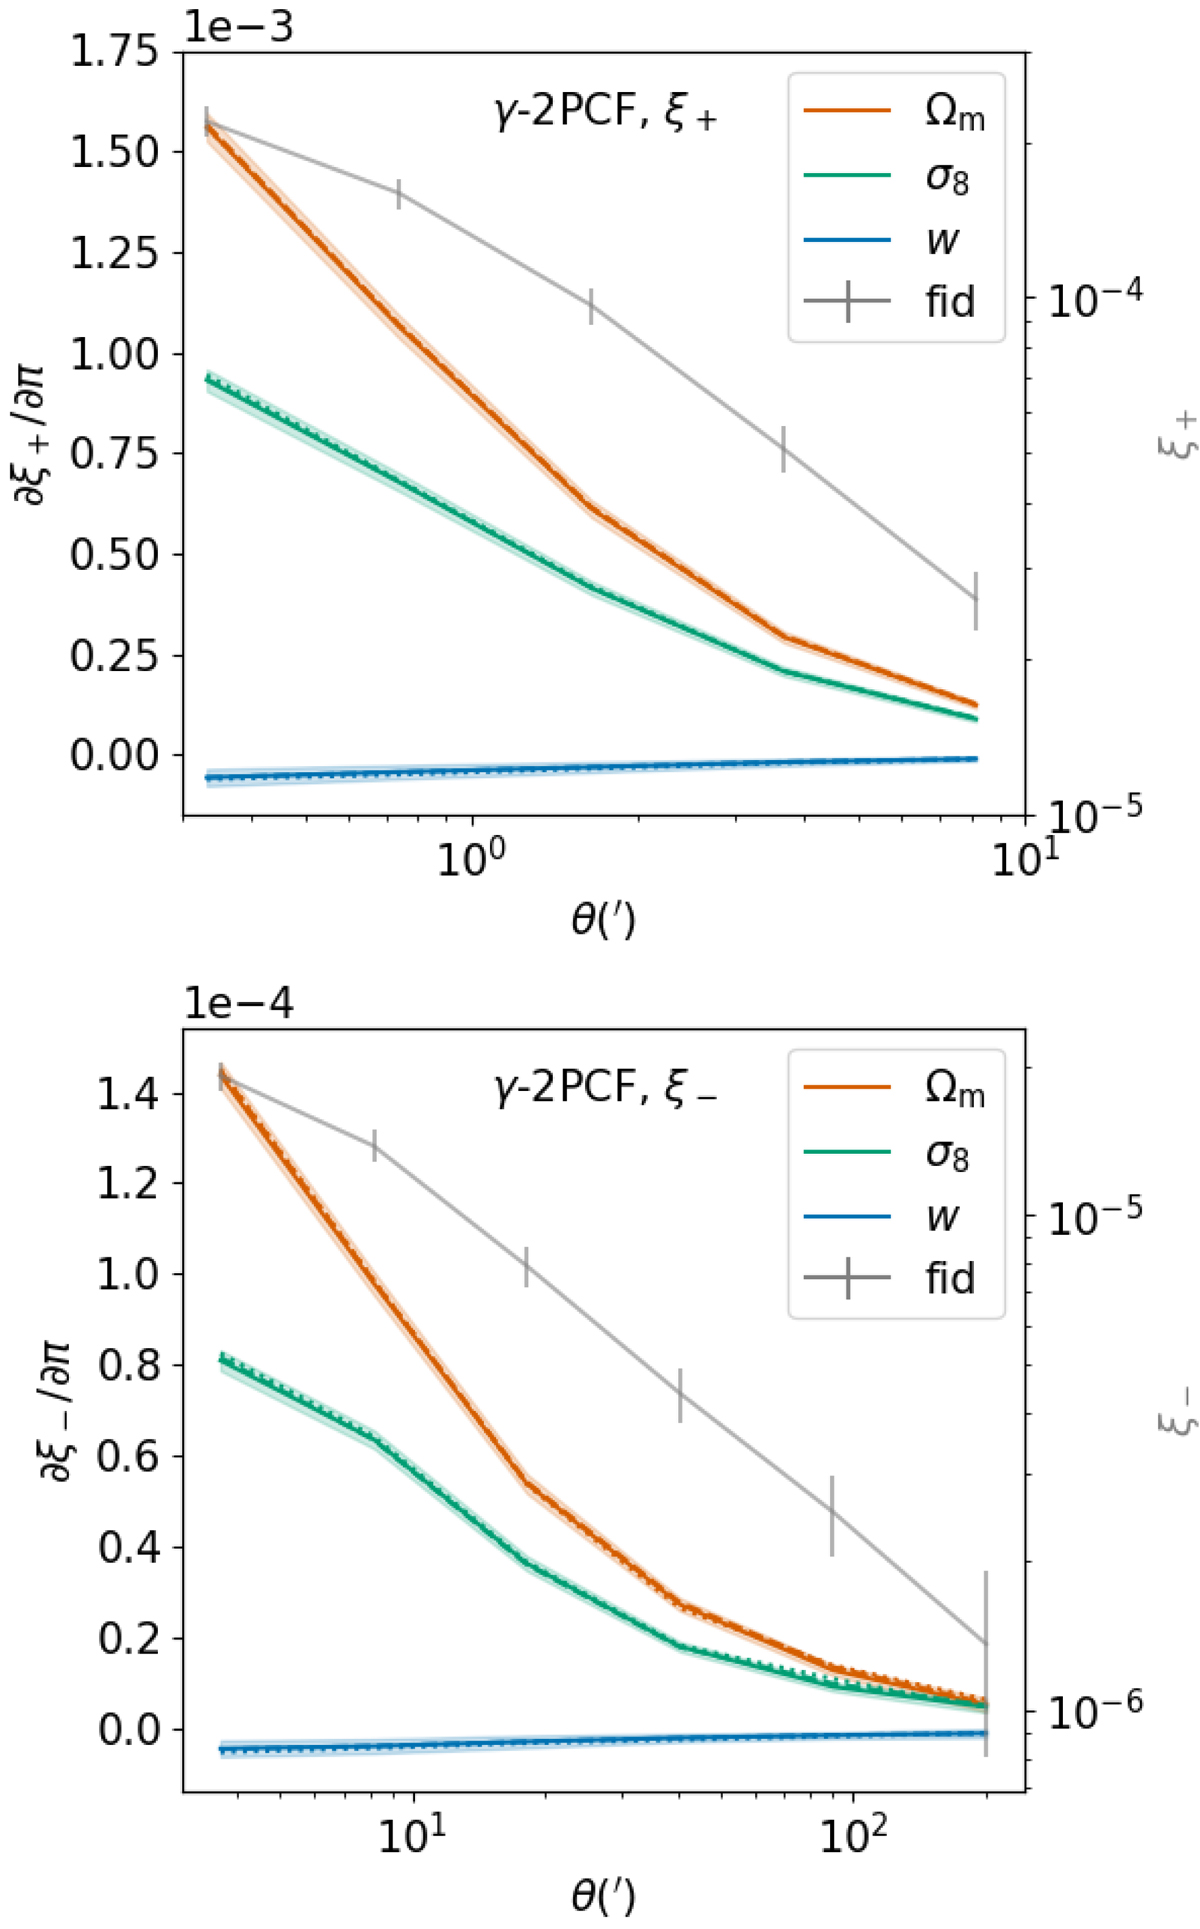
Download original image
γ-2PCF ξ+ (top) and ξ− (bottom) DVs and derivatives. The gray lines, whose scale is given by the second axis, correspond to the average DVs computed from the 924 SLICS realizations. The Fisher derivatives (defined in Eq. (47)) are computed from the DUSTGRAIN-pathfinder simulations with large variations of Ωm (orange), σ8 (green), and w (blue). The solid, dashed, and dotted lines respectively correspond to the average over 128, 64, and 32 realizations. The shaded areas represent the uncertainty computed from the 128 DUSTGRAIN-pathfinder realizations, and the gray error bars those of the 924 SLICS realizations. The inclusion of the dashed and dotted lines within the shaded areas highlights the low numerical noise.
Current usage metrics show cumulative count of Article Views (full-text article views including HTML views, PDF and ePub downloads, according to the available data) and Abstracts Views on Vision4Press platform.
Data correspond to usage on the plateform after 2015. The current usage metrics is available 48-96 hours after online publication and is updated daily on week days.
Initial download of the metrics may take a while.