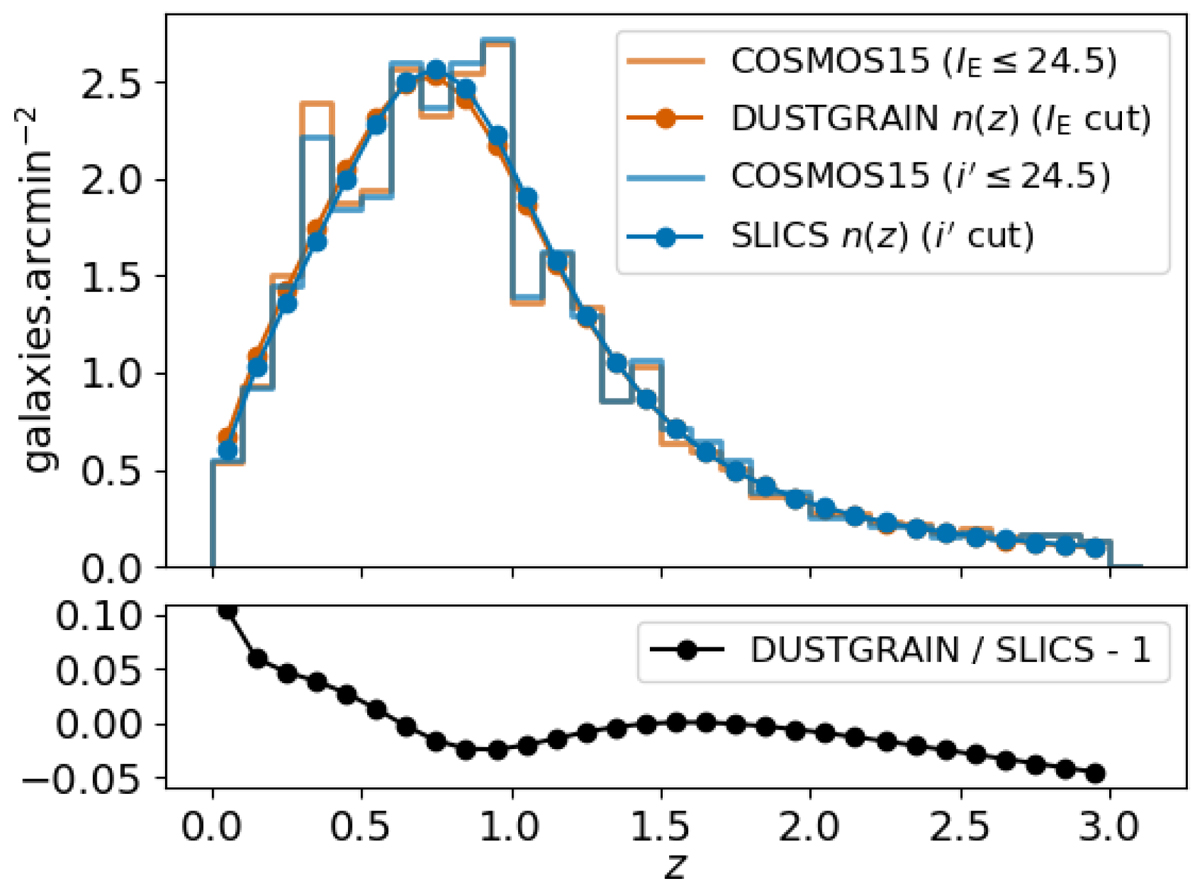
Fig. 3.
Download original image
Top: Redshift distributions of the mocks built from the DUSTGRAIN-pathfinder (red dots) and SLICS (blue dots) simulations, normalized to 30 galaxies per arcmin2. These correspond to a Fu et al. (2008) fit to the Laigle et al. (2016) COSMOS2015 catalog after removing galaxies with magnitudes IE ≥ 24.5 and i′≥24.5 for DUSTGRAIN-pathfinder and SLICS, respectively (red and blue histograms). Bottom: Fractional difference between the DUSTGRAIN-pathfinder and SLICS redshift distributions. The difference is always below 5% except for redshifts lower than 0.2.
Current usage metrics show cumulative count of Article Views (full-text article views including HTML views, PDF and ePub downloads, according to the available data) and Abstracts Views on Vision4Press platform.
Data correspond to usage on the plateform after 2015. The current usage metrics is available 48-96 hours after online publication and is updated daily on week days.
Initial download of the metrics may take a while.