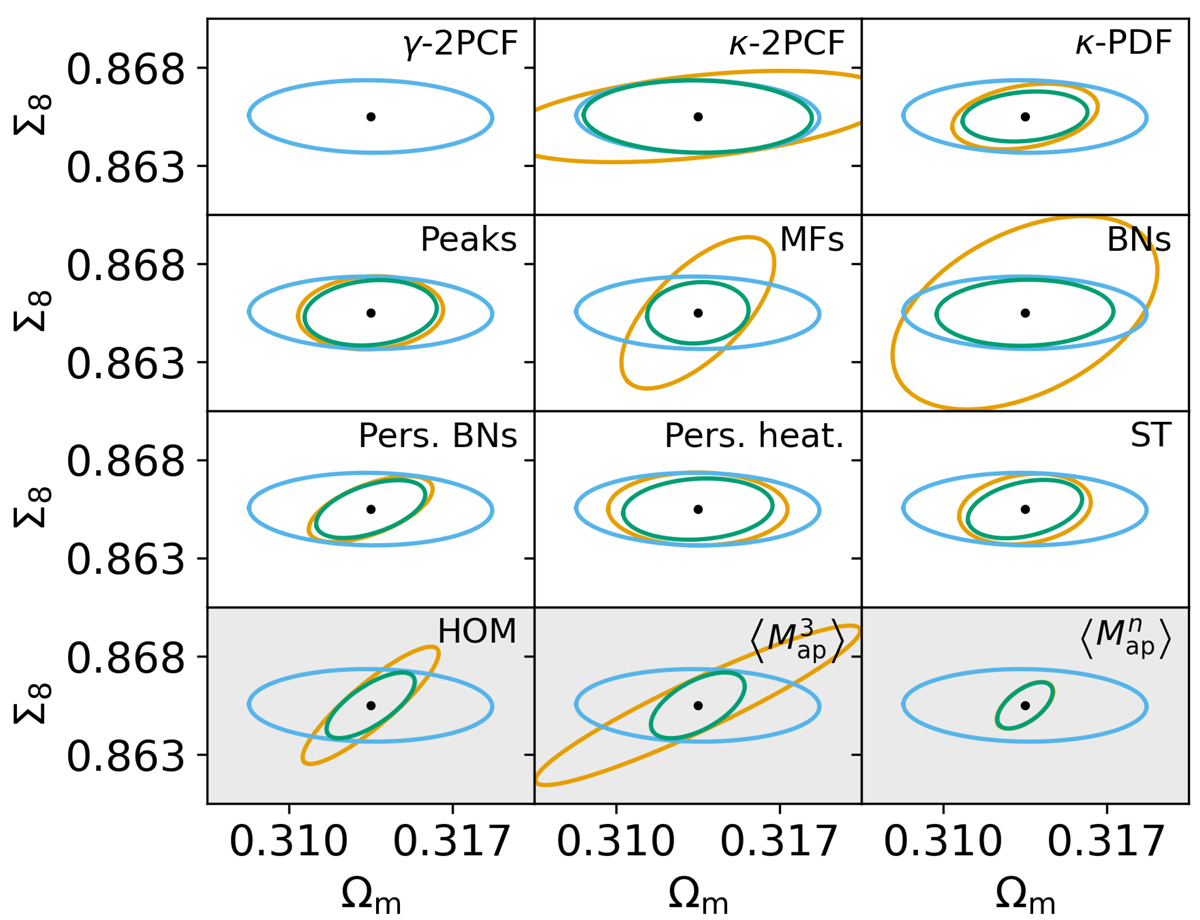
Fig. A.1.
Download original image
Same as Fig. 19, but for (Ωm, Σ8) instead of (Ωm, σ8), with Σ8 = σ8(Ωm/0.3)α and α = 0.63. Individual Fisher forecasts in the Σ8-Ωm plane for a nontomographic Euclid-like survey for the 11 statistics (orange) and γ-2PCF (blue), as well as their combination (green). The corresponding marginalized precision on CPs can be found in Table A.1. The bottom row with the gray shaded backgrounds displays probes that are not Gaussian distributed and cannot be robustly interpreted with Fisher forecasts. The abbreviated name of each summary statistic is displayed in the top-right part of each panel: γ-2PCF and κ-2PCF for the shear and convergence two-point correlation functions, κ-PDF for the convergence one-point probability distribution, peaks for aperture mass peak counts, MFs for convergence Minkowski functionals, BNs for convergence Betti numbers, pers. BNs and pers. heat. for aperture mass persistent homology Betti numbers and heatmap, ST for convergence scattering transform coefficients, HOM for higher-order convergence moments, and ![]() and
and ![]() for third and n-th order aperture mass moments.
for third and n-th order aperture mass moments.
Current usage metrics show cumulative count of Article Views (full-text article views including HTML views, PDF and ePub downloads, according to the available data) and Abstracts Views on Vision4Press platform.
Data correspond to usage on the plateform after 2015. The current usage metrics is available 48-96 hours after online publication and is updated daily on week days.
Initial download of the metrics may take a while.