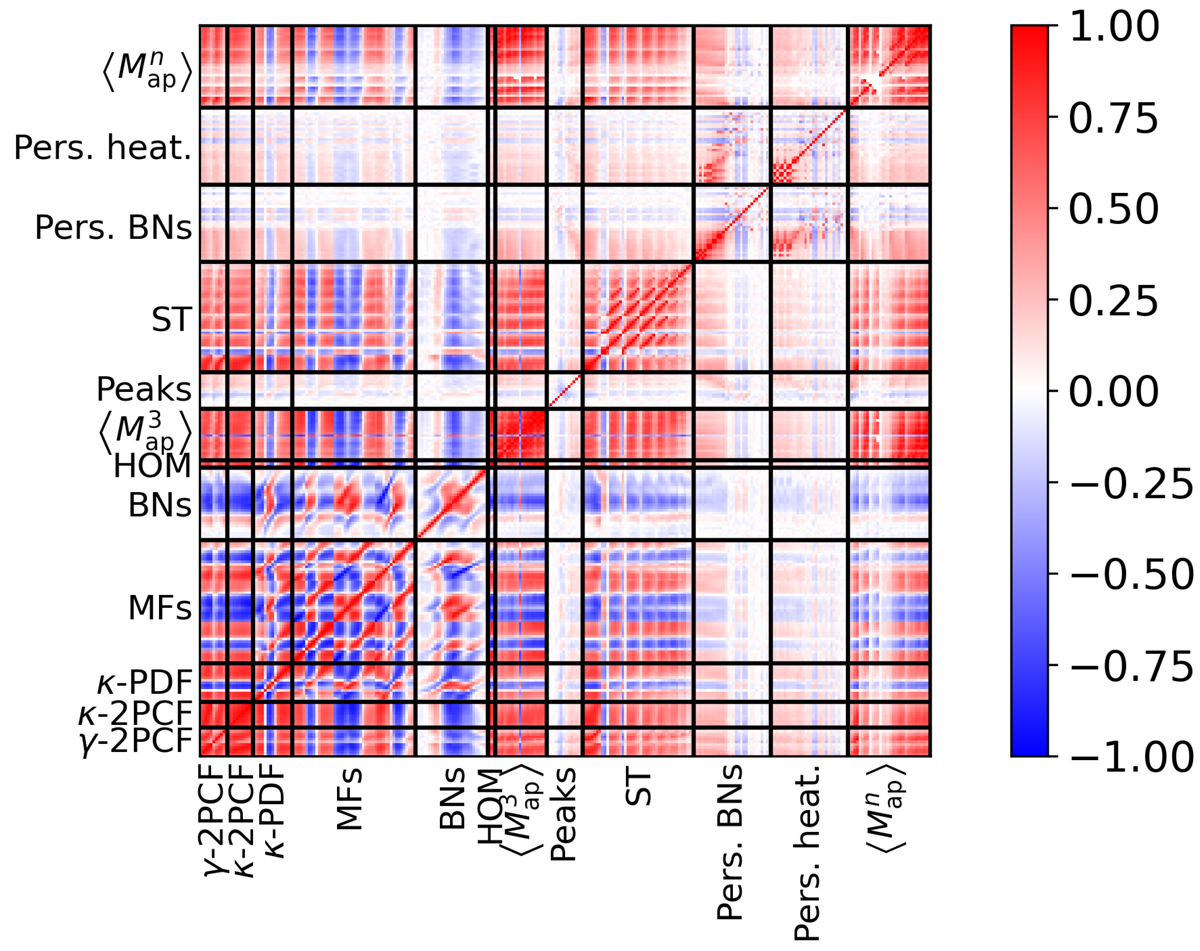
Fig. 21.
Download original image
Correlation matrix for all 12 statistics tested in our analysis and referenced in Table 3, computed from the same 924 SLICS simulations. We note the complex correlations between the different statistics due to their expressions as well as to different filtering shapes and scales in the post-processing of the mass maps. The bin sizes of the κ-PDF, MFs, and BNs DVs have been increased in the figure for visualization purposes.
Current usage metrics show cumulative count of Article Views (full-text article views including HTML views, PDF and ePub downloads, according to the available data) and Abstracts Views on Vision4Press platform.
Data correspond to usage on the plateform after 2015. The current usage metrics is available 48-96 hours after online publication and is updated daily on week days.
Initial download of the metrics may take a while.