Fig. 20.
Download original image
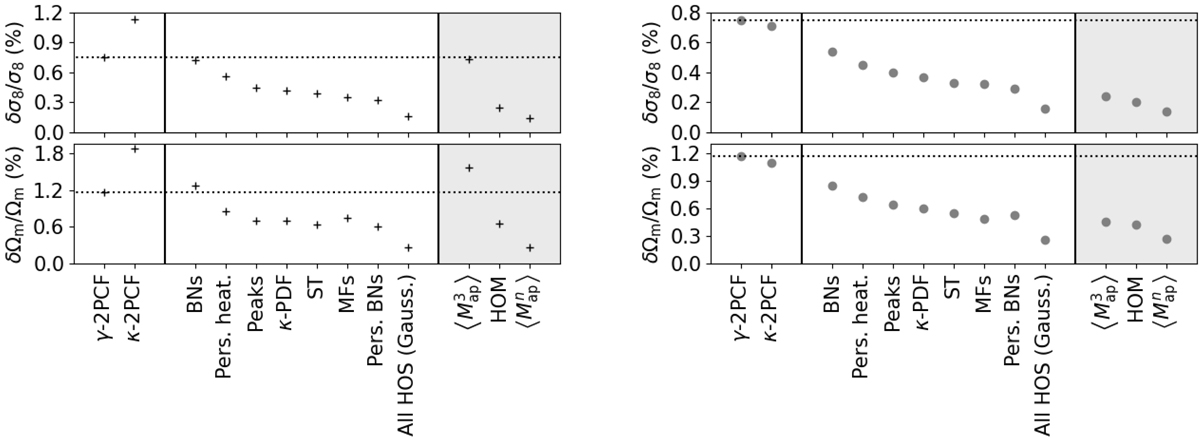
Fisher forecasts for σ8 and Ωm for a nontomographic Euclid-like survey for all statistics. The black crosses (left) show the individual forecasts and the gray circles (right) the forecasts combined with the γ-2PCF. Forecasts are ranked within 3 categories: two-point statistics, higher-order Gaussian statistics, and higher-order non-Gaussian statistics. The latter are displayed on a gray background as they should be confirmed with a non-Gaussian likelihood framework. The corresponding marginalized precision on CPs can be found in Table 5.
Current usage metrics show cumulative count of Article Views (full-text article views including HTML views, PDF and ePub downloads, according to the available data) and Abstracts Views on Vision4Press platform.
Data correspond to usage on the plateform after 2015. The current usage metrics is available 48-96 hours after online publication and is updated daily on week days.
Initial download of the metrics may take a while.