Fig. 2.
Download original image
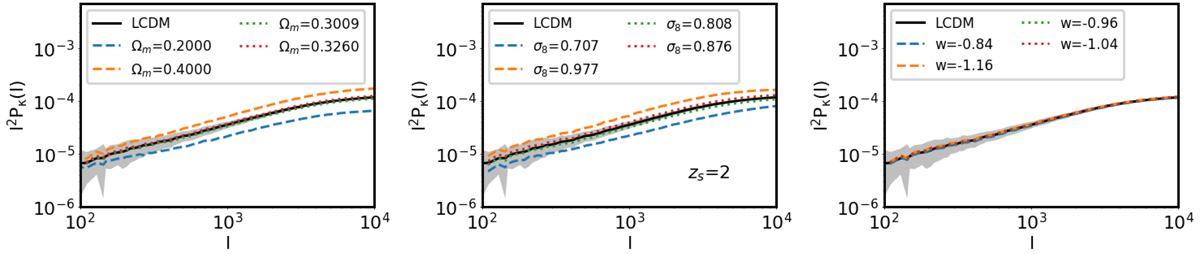
Convergence power spectra for sources at zs = 2. From left to right, we exhibit the runs that account for Ωm, σ8 and w variations, respectively. The curves show the average over all 128 line of sight realizations, and the gray areas show the scatter of the convergence power spectrum around the mean value for the reference ΛCDM simulation (256 lines of sight) considering a field of view of 5 deg on a side.
Current usage metrics show cumulative count of Article Views (full-text article views including HTML views, PDF and ePub downloads, according to the available data) and Abstracts Views on Vision4Press platform.
Data correspond to usage on the plateform after 2015. The current usage metrics is available 48-96 hours after online publication and is updated daily on week days.
Initial download of the metrics may take a while.