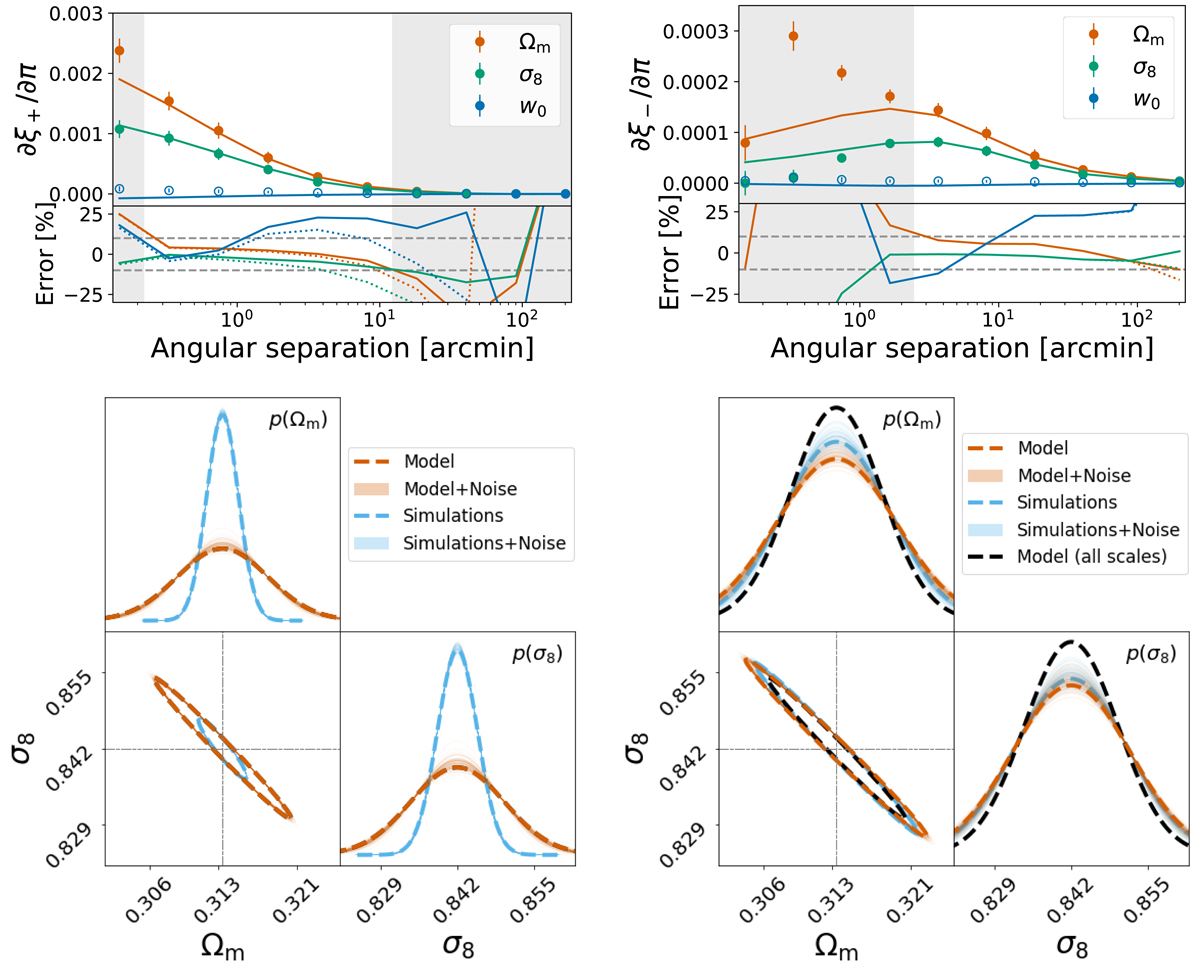
Fig. 17.
Download original image
Upper row: Comparison of the derivatives of the γ-2PCF as predicted from theory (solid lines) and as measured from the DUSTGRAIN-pathfinder simulations (dots). The errorbars are scaled to a single line-of-sight in the DUSTGRAIN-pathfinder ensemble. The shaded regions display the scales that were discarded from the Fisher analysis presented in this work. In the lower panel we plot the relative deviation between the measured quantities and the theoretical predictions when accounting for (solid lines) or neglecting (dotted lines) finite field effects. The gray dashed lines display the 10 percent errorband. Lower row: Comparison of the Fisher forecast using the theoretical model (orange dashed) or the simulation measurements (blue dashed). The thin solid lines correspond to simulated analyses that are used to test the stability of the ellipses given the numerical noise in the derivatives. For the panel on the left we use all available scales on the γ-2PCF while for the figure on the right only the scales with realistic numerical derivatives (i.e., removing the gray shaded area of the upper panel) are included in the forecast. In the figure on the right we show for reference again the constraints of the theoretical model with all scales included.
Current usage metrics show cumulative count of Article Views (full-text article views including HTML views, PDF and ePub downloads, according to the available data) and Abstracts Views on Vision4Press platform.
Data correspond to usage on the plateform after 2015. The current usage metrics is available 48-96 hours after online publication and is updated daily on week days.
Initial download of the metrics may take a while.