Fig. 15.
Download original image
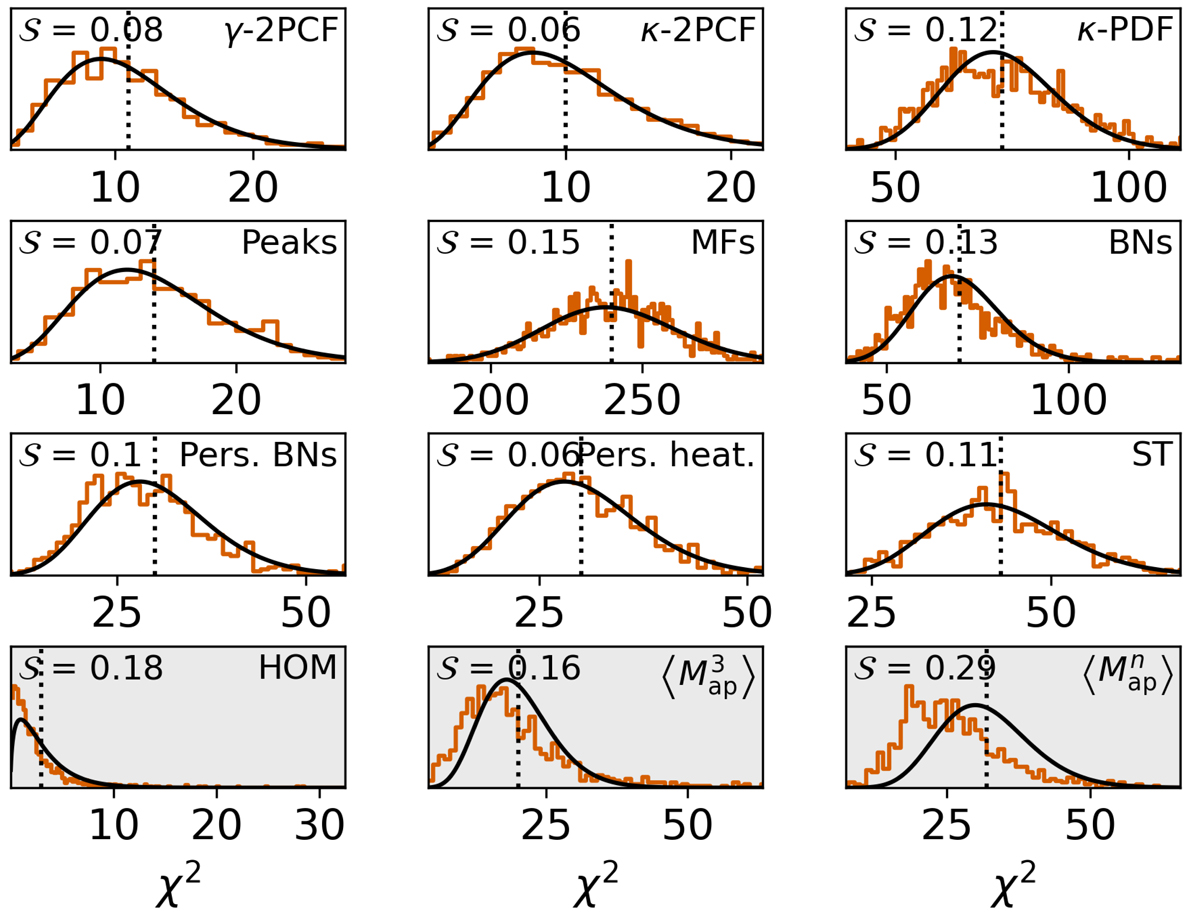
Verification of the Gaussian hypothesis for all statistics computed in this analysis. For a Gaussian-distributed DV, the histogram of χ2 values from the SLICS simulations (red) should match the theoretical prediction (black) modulo the sampling noise across the finite set of 924 realizations. The corresponding SMAPE value (Eq. (45)) is given in the top left quadrant of each panel. 𝒮 ≤ 0.15 indicates compatibility with the Gaussian hypothesis, which is verified for all statistics but the three bottom panels with gray shaded background. The y-axes correspond to the frequency of each χ2 bin value across the SLICS and are different for each panel.
Current usage metrics show cumulative count of Article Views (full-text article views including HTML views, PDF and ePub downloads, according to the available data) and Abstracts Views on Vision4Press platform.
Data correspond to usage on the plateform after 2015. The current usage metrics is available 48-96 hours after online publication and is updated daily on week days.
Initial download of the metrics may take a while.