Fig. 8
Download original image
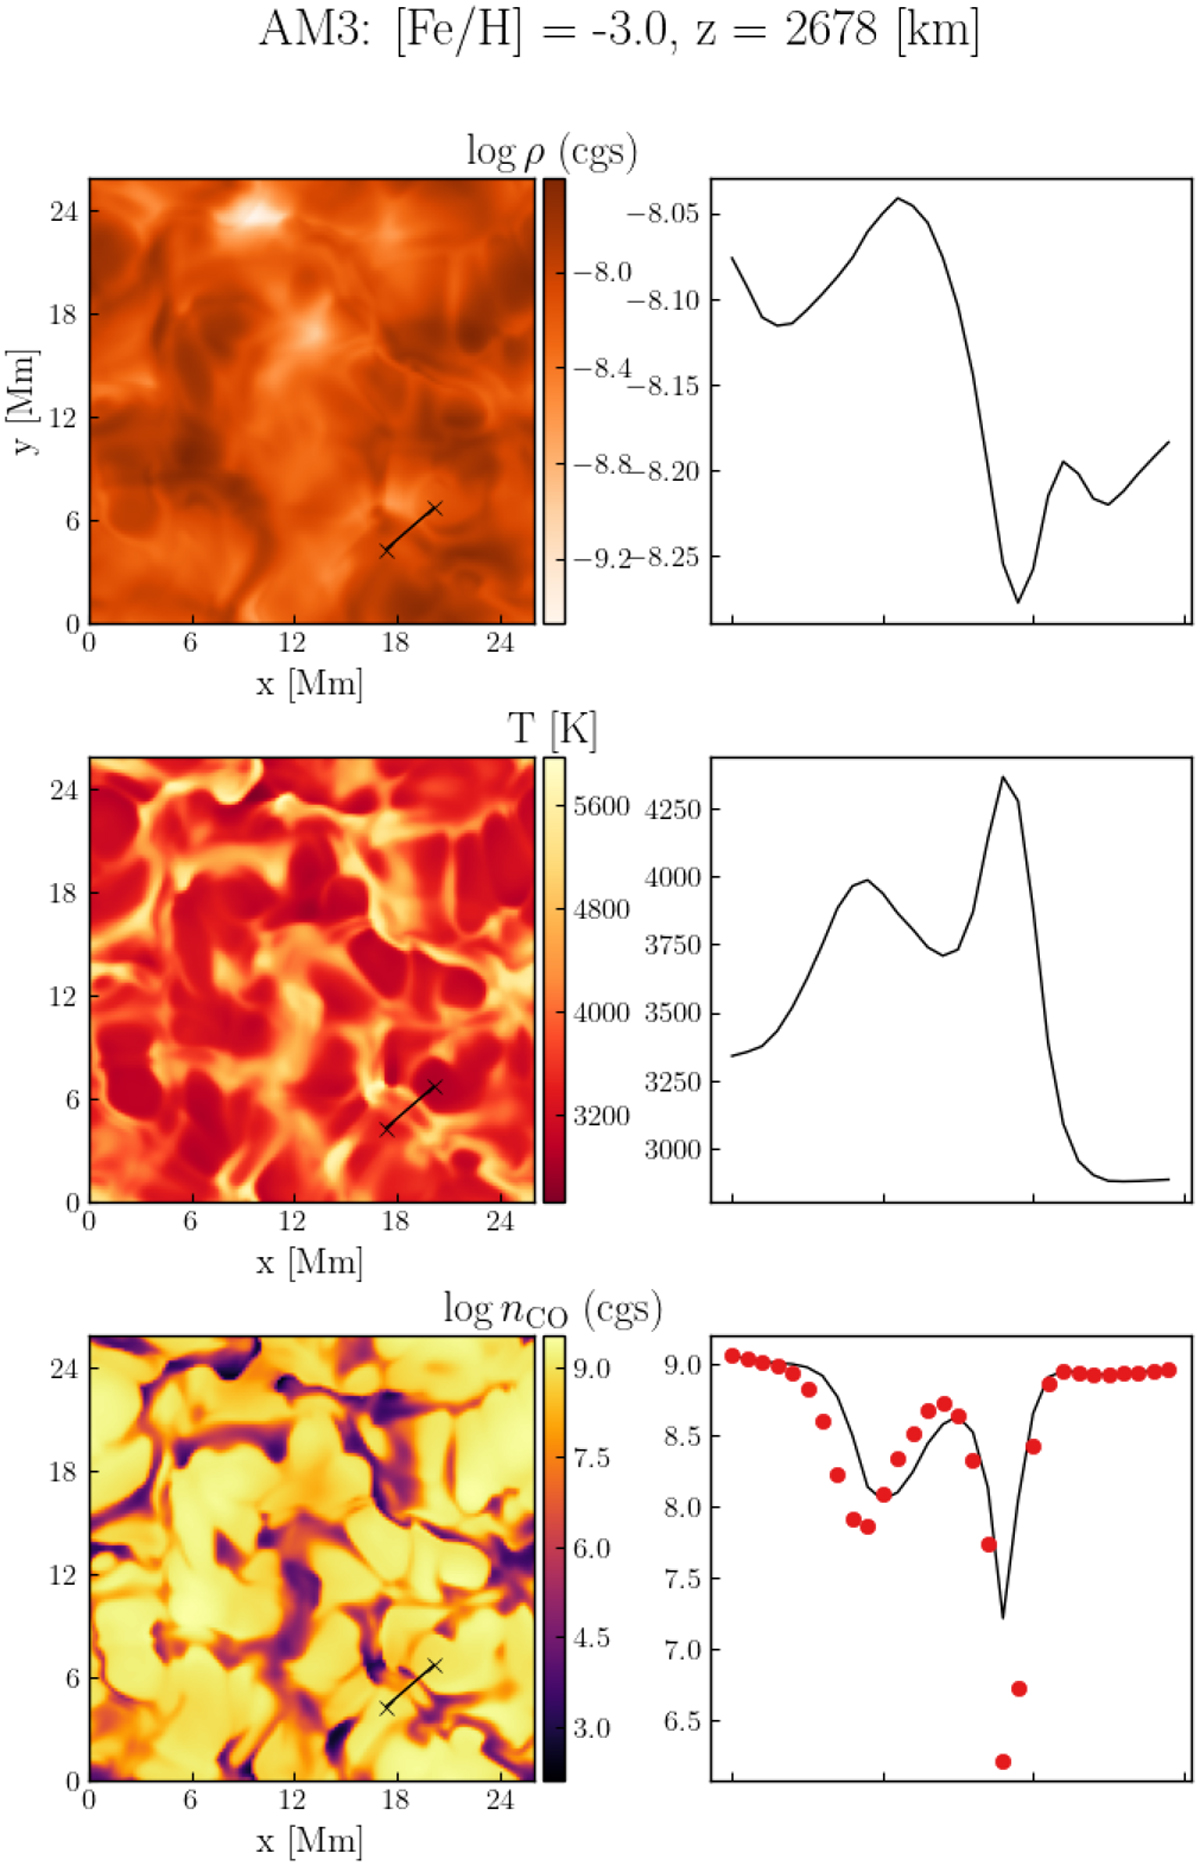
Gas density, temperature, and the number density of CO molecules in a slice across the AM3 atmosphere. The left panels show the 2D heat maps of these quantities, and the right panels show a 1D cut across a prototypical downflow feature, depicted by the solid black line in the top panels. The bottom right panel shows the time-dependent number density as a solid black line and the equilibrium number density as red points.
Current usage metrics show cumulative count of Article Views (full-text article views including HTML views, PDF and ePub downloads, according to the available data) and Abstracts Views on Vision4Press platform.
Data correspond to usage on the plateform after 2015. The current usage metrics is available 48-96 hours after online publication and is updated daily on week days.
Initial download of the metrics may take a while.