Open Access
Fig. 7
Download original image
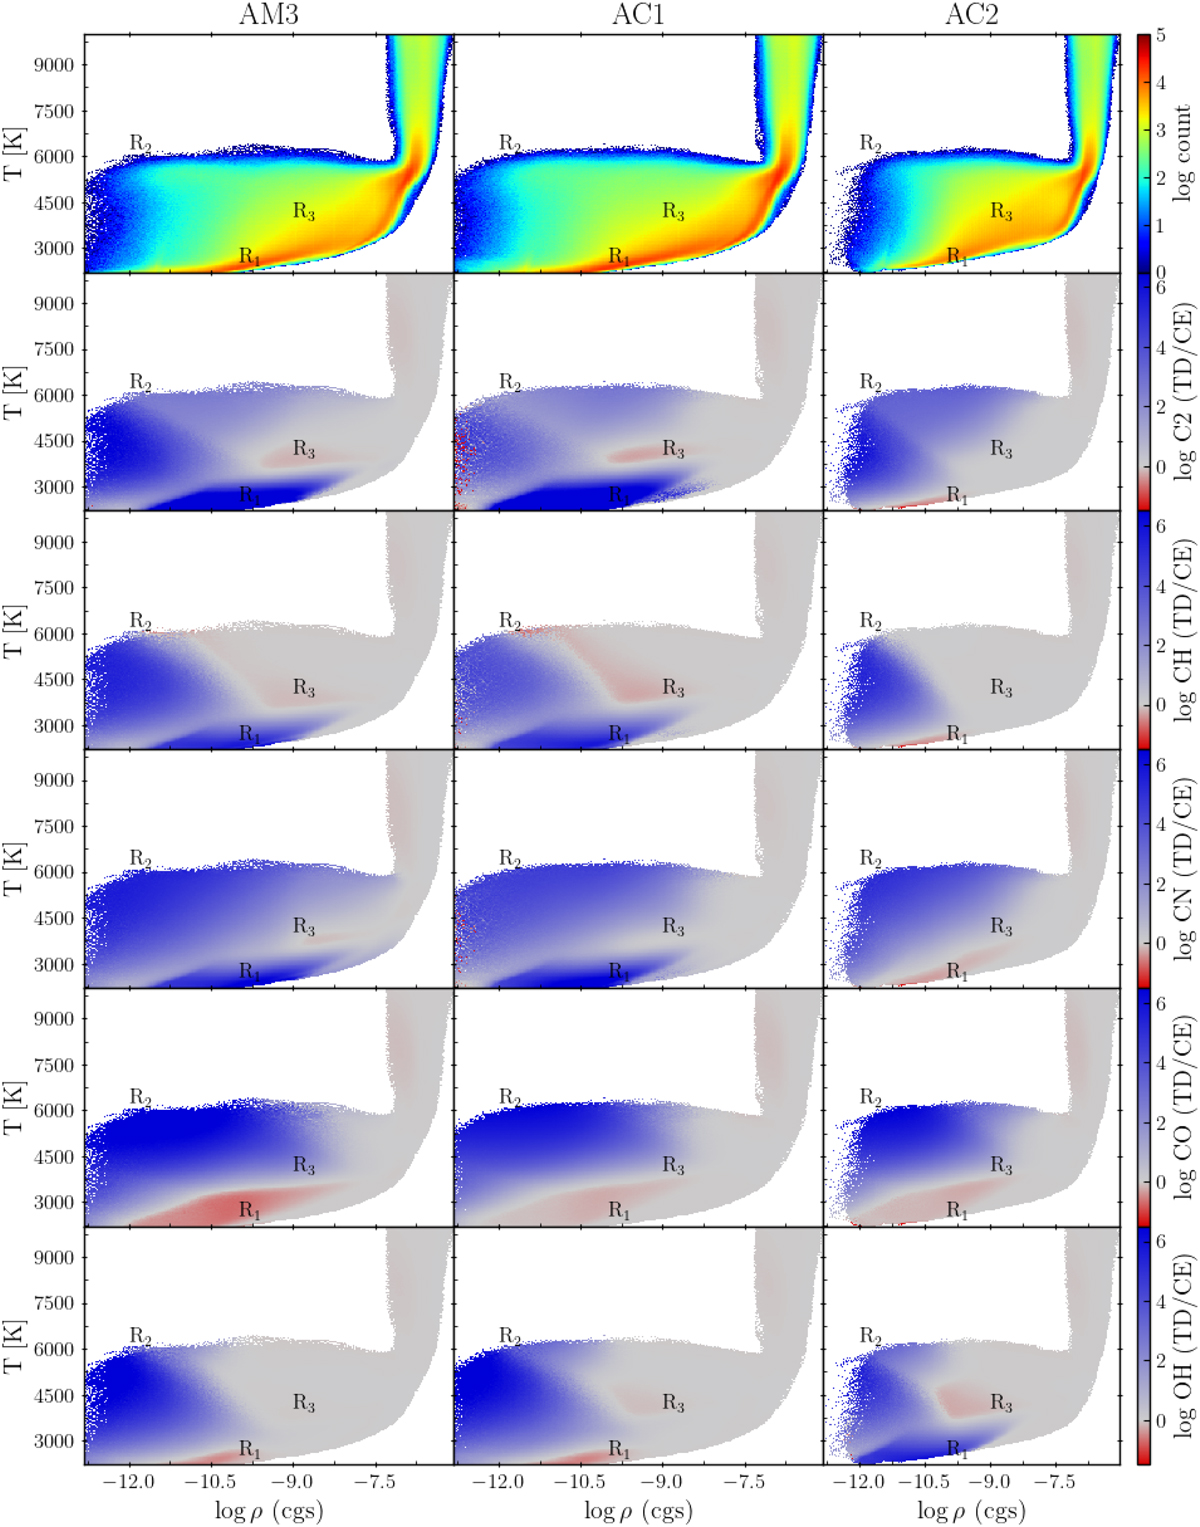
Heat maps of binned quantities for models AM3, AC1, and AC2. Each quantity was binned using 20 snapshots of each 3D model. Deviations from equilibrium are seen in three distinct regions, labelled R1 (convective cells in the upper photosphere), R2 (shock fronts in the chromosphere), and R3 (wake of the shock).
Current usage metrics show cumulative count of Article Views (full-text article views including HTML views, PDF and ePub downloads, according to the available data) and Abstracts Views on Vision4Press platform.
Data correspond to usage on the plateform after 2015. The current usage metrics is available 48-96 hours after online publication and is updated daily on week days.
Initial download of the metrics may take a while.