Open Access
Fig. B.5
Download original image
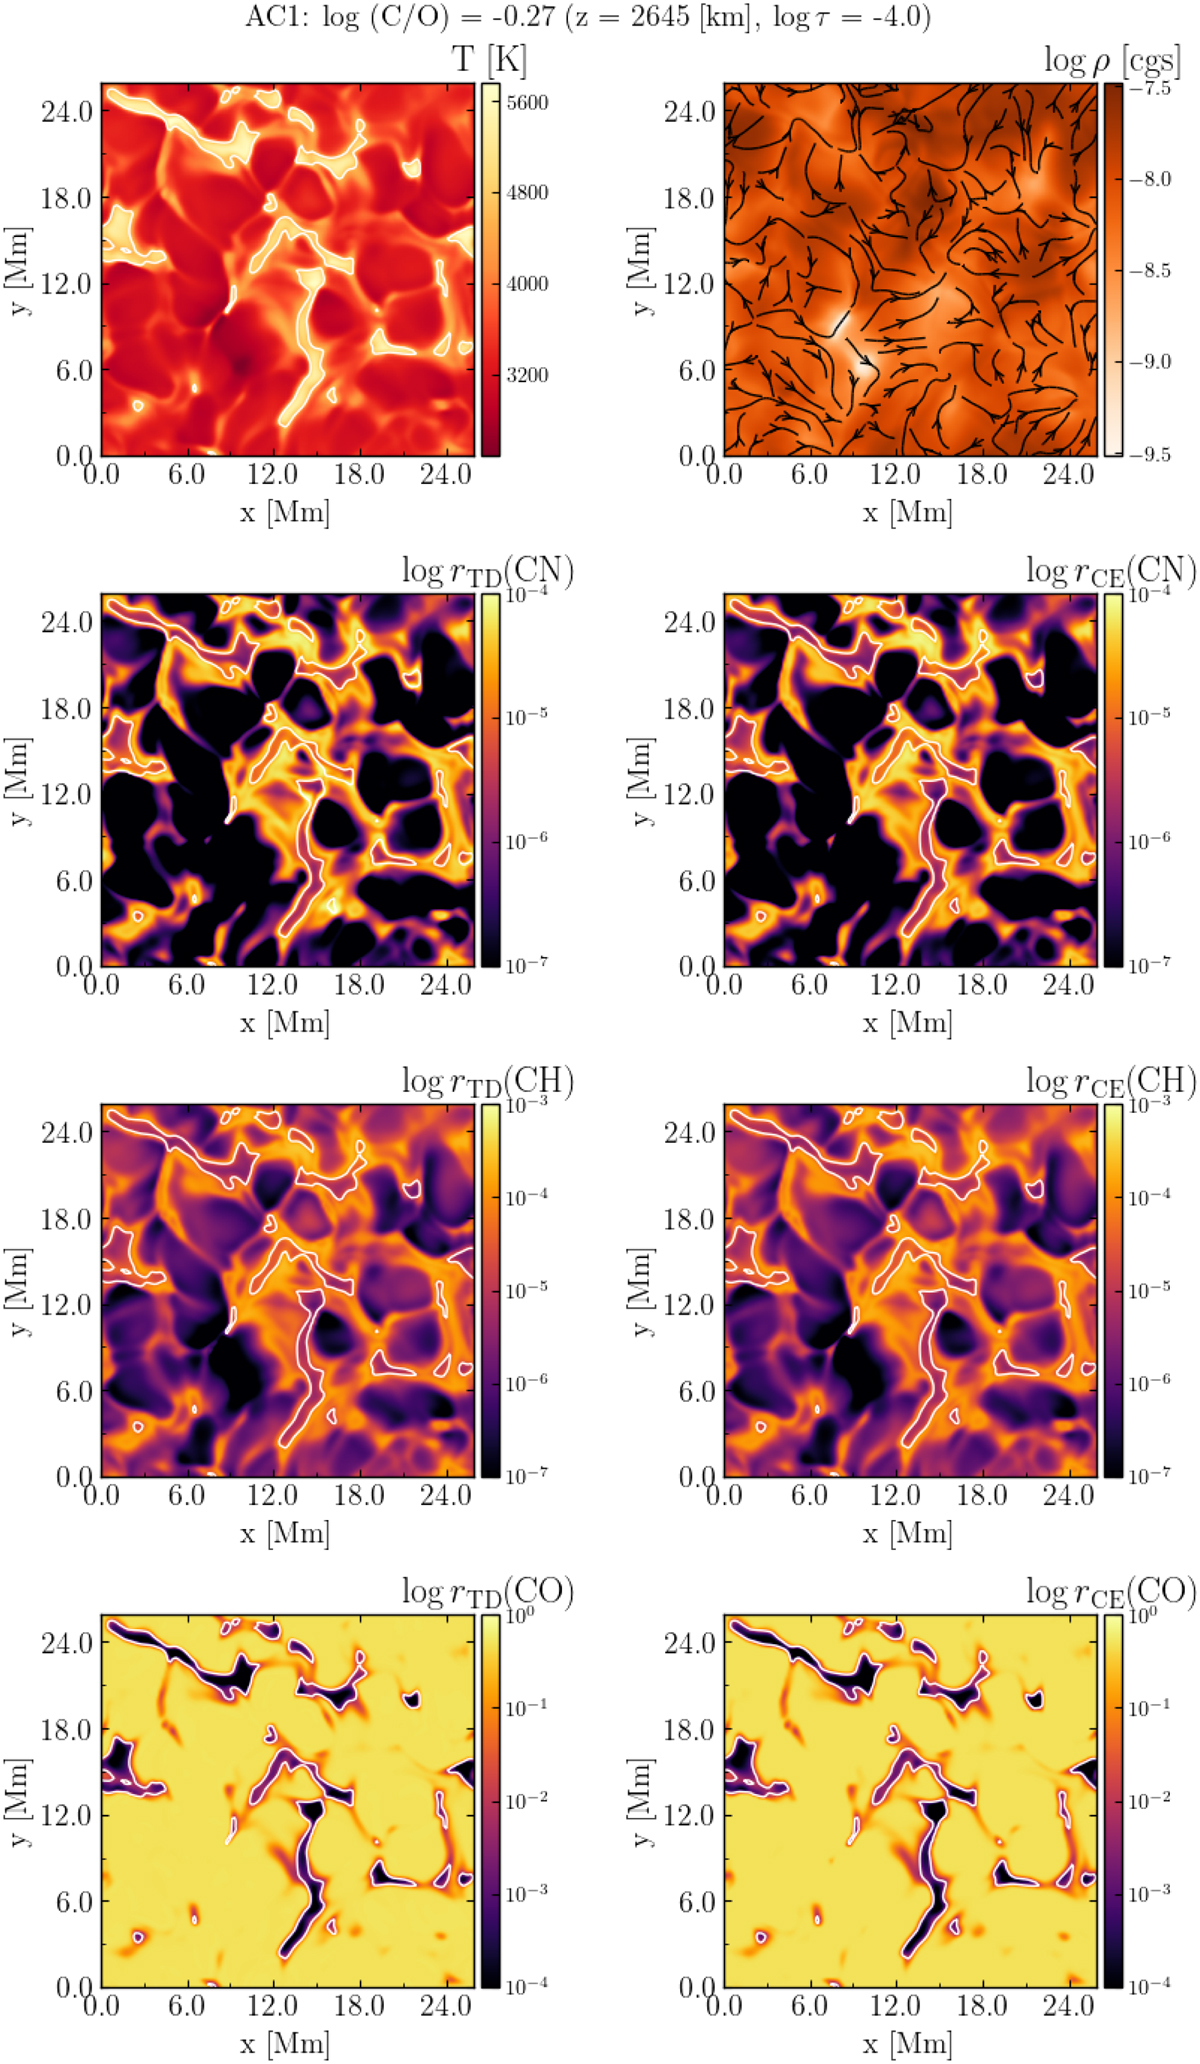
As Fig. 4, but with a C and O enhancement of +2.0 dex and C/O = −0.27 The contour line traces a temperature of 4900 K. The chemistry is almost entirely in equilibrium in this layer of the atmosphere (due to the enhanced C and O abundances), and minor deviations are visible only for CN around the hotter regions.
Current usage metrics show cumulative count of Article Views (full-text article views including HTML views, PDF and ePub downloads, according to the available data) and Abstracts Views on Vision4Press platform.
Data correspond to usage on the plateform after 2015. The current usage metrics is available 48-96 hours after online publication and is updated daily on week days.
Initial download of the metrics may take a while.