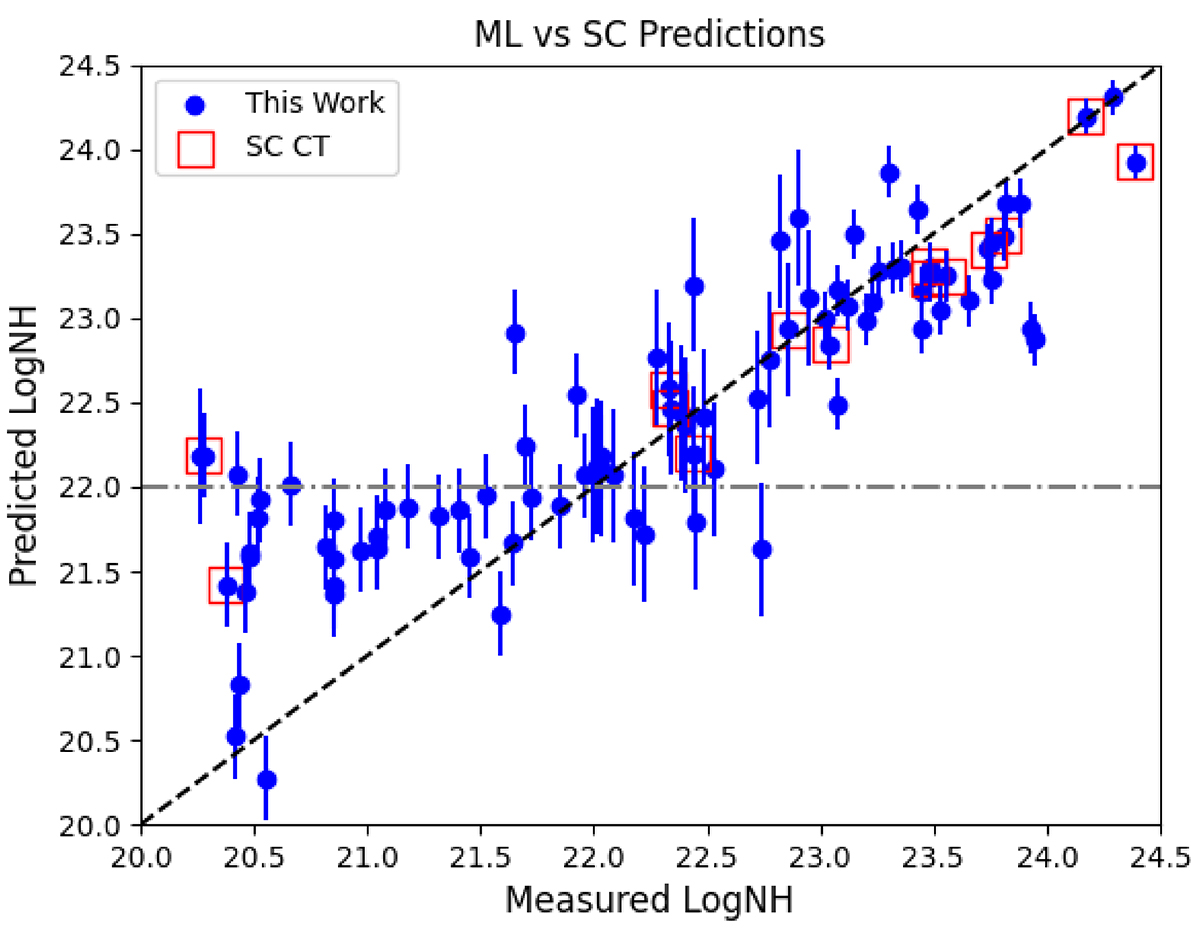
Fig. 7.
Download original image
ML vs. previous methods. As in Fig. 4, the x-axis shows the true line-of-sight Log(NH) values determined via spectral fitting while the y-axis shows the Log(NH) values predicted by our machine learning algorithm (blue circles). The red squares represent the 14 sources that were predicted to be CT based on the SC method introduced in Koss et al. (2016). Two of these sources (14%) have true NH values < 1022 cm−2. Our algorithm does not misclassify any unobscured sources as Compton-thin, let alone CT. The errors from our algorithm were calculated statistically as described in the caption of Fig. 4.
Current usage metrics show cumulative count of Article Views (full-text article views including HTML views, PDF and ePub downloads, according to the available data) and Abstracts Views on Vision4Press platform.
Data correspond to usage on the plateform after 2015. The current usage metrics is available 48-96 hours after online publication and is updated daily on week days.
Initial download of the metrics may take a while.