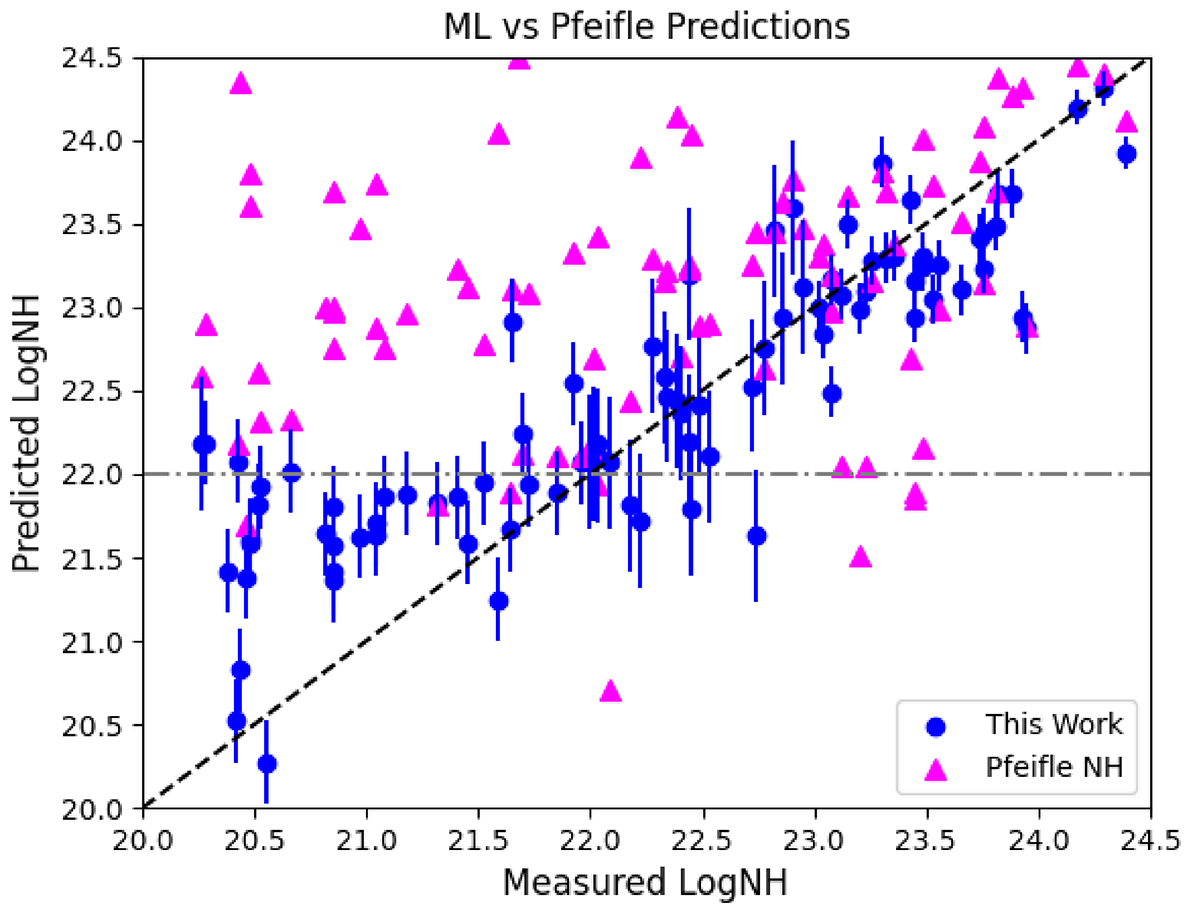
Fig. 6.
Download original image
ML vs. previous methods. As in Fig. 4, the x-axis shows the true line-of-sight Log(NH) values determined by spectral fitting while the y-axis shows the Log(NH) values predicted by our machine learning algorithm (blue circles) and by the Pfeifle et al. (2022) relation (magenta triangles). The errors from our algorithm were calculated statistically as described in the caption of Fig. 4. No errors are included on the magenta points for readability purposes.
Current usage metrics show cumulative count of Article Views (full-text article views including HTML views, PDF and ePub downloads, according to the available data) and Abstracts Views on Vision4Press platform.
Data correspond to usage on the plateform after 2015. The current usage metrics is available 48-96 hours after online publication and is updated daily on week days.
Initial download of the metrics may take a while.