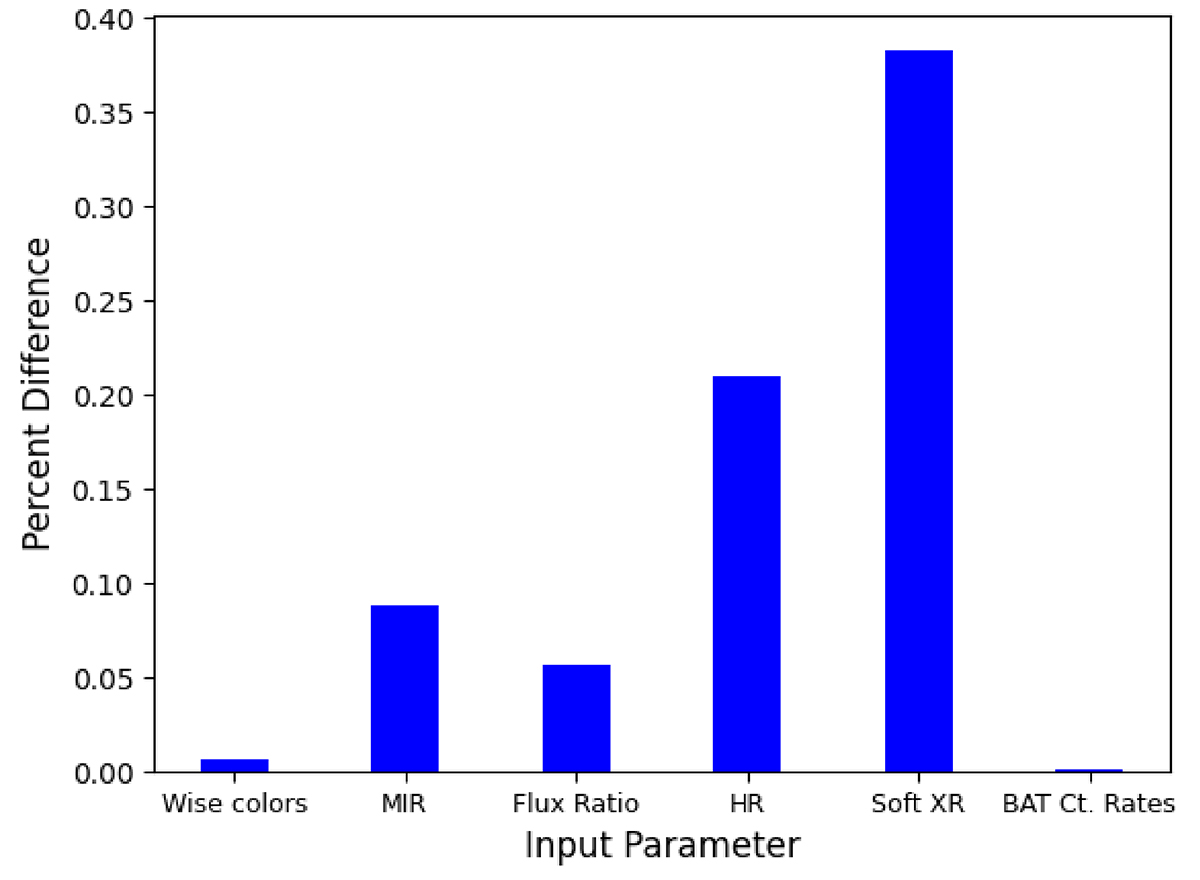
Fig. 5.
Download original image
Percent difference between the Spearman correlation coefficient including all parameters and the coefficient when the listed parameter is excluded. The larger the difference, the worse the fit without that parameter (i.e. the higher the importance of that parameter). Therefore, the soft X-ray-related parameters are the highest contributors to the predictive capability of the algorithm. “MIR” refers to the WISE colors and the MIR-X-ray flux ratio. “HR” represents the two X-ray HRs. “Soft XR” refers to the two X-ray HRs and the MIR-X-ray flux ratio.
Current usage metrics show cumulative count of Article Views (full-text article views including HTML views, PDF and ePub downloads, according to the available data) and Abstracts Views on Vision4Press platform.
Data correspond to usage on the plateform after 2015. The current usage metrics is available 48-96 hours after online publication and is updated daily on week days.
Initial download of the metrics may take a while.