Fig. 4.
Download original image
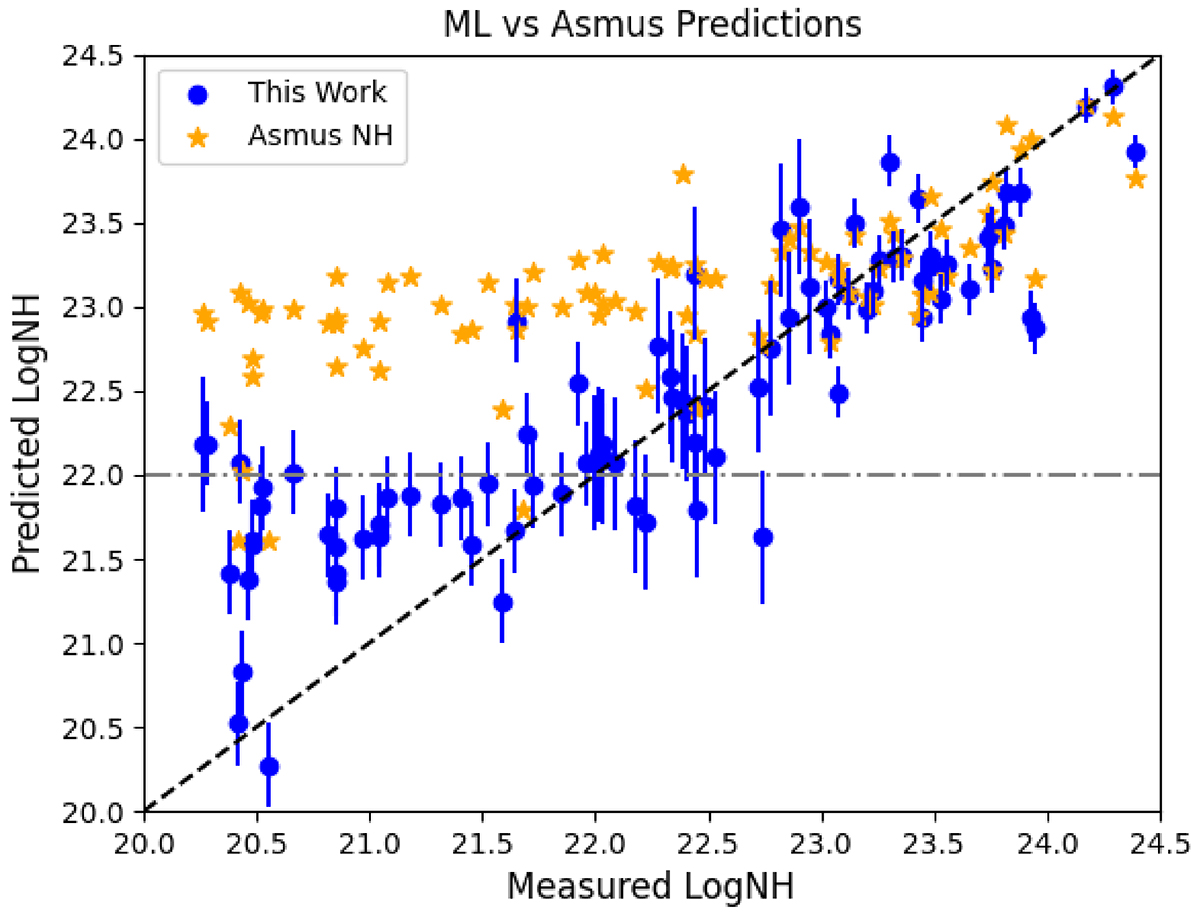
ML vs. previous methods. The x-axis shows the “true” line-of-sight Log(NH) values, as determined by spectral fitting. The y-axis shows the Log(NH) values predicted by our machine learning algorithm (blue circles) and those predicted by the Asmus et al. (2015) equation (orange stars). Our algorithm shows superior predictive capabilities, particularly for lower levels of obscuration (Log(NH) < 23), where our algorithm does not incorrectly classify unobscured sources as heavily obscured as displayed by the dash-dotted gray line. The dotted black line represents the one-to-one ratio between the true and predicted NH values. The uncertainties were calculated statistically based on the different classifications listed in Table 1. We determine the error that needs to be added or subtracted to the predicted NH values in order to achieve a 90% classification accuracy in each bin. Thus, each of the four classification bins have different uncertainties. No errors are included on the orange points for readability purposes.
Current usage metrics show cumulative count of Article Views (full-text article views including HTML views, PDF and ePub downloads, according to the available data) and Abstracts Views on Vision4Press platform.
Data correspond to usage on the plateform after 2015. The current usage metrics is available 48-96 hours after online publication and is updated daily on week days.
Initial download of the metrics may take a while.