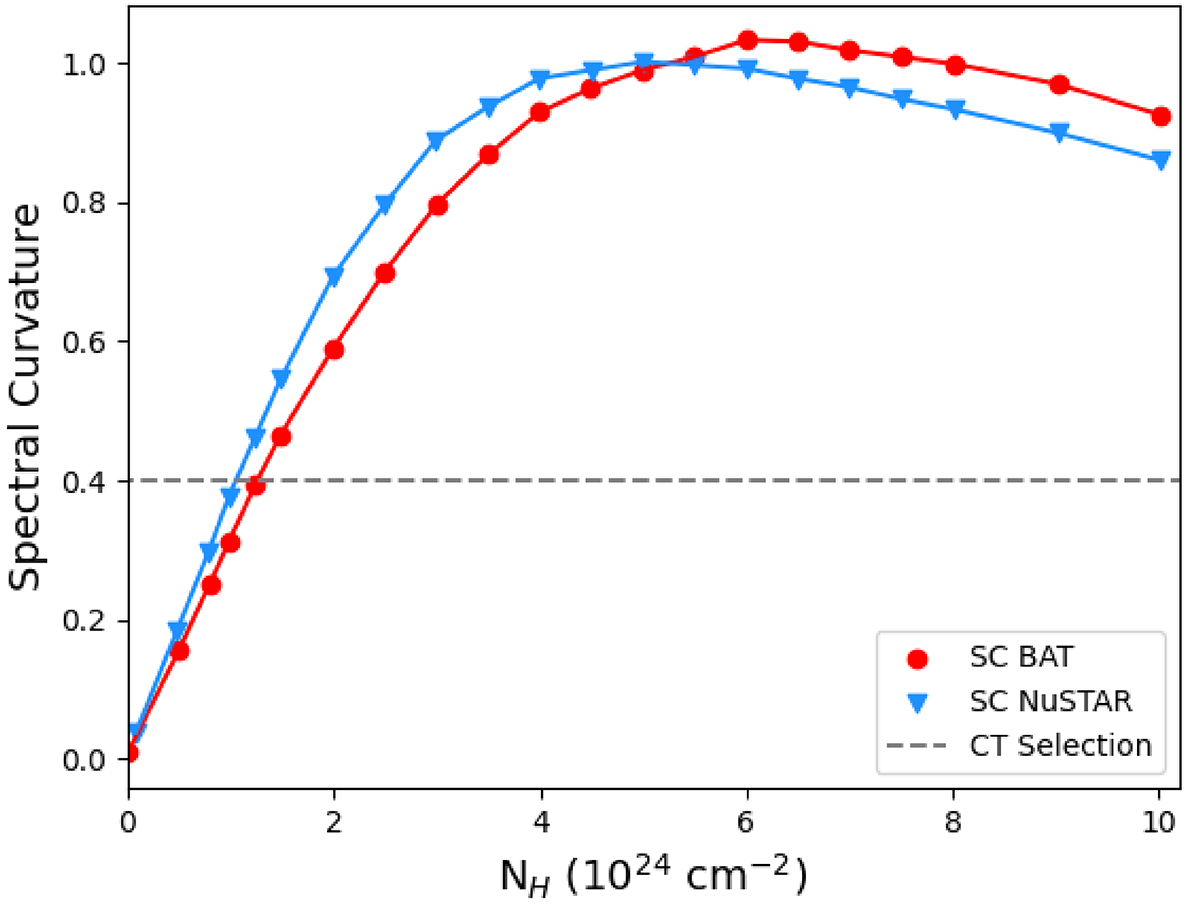
Fig. 3.
Download original image
Spectral curvature value based on different column densities, displaying some of the configurations adapted from Fig. 3 of Koss et al. (2016). Each curve represents how the SC value changes with NH based on different input parameters used in the MYTorus model simulations. The red circles show the curve when the SC equation is calibrated to Swift-BAT data, while the blue triangles show the different SC equation when calibrated to NuSTAR data. The dashed gray line indicates the cutoff for CT-AGN determined by Koss et al. (2016). Both lines illustrate how the increased curvature of the hard X-rays of AGN is related to an increase in column density.
Current usage metrics show cumulative count of Article Views (full-text article views including HTML views, PDF and ePub downloads, according to the available data) and Abstracts Views on Vision4Press platform.
Data correspond to usage on the plateform after 2015. The current usage metrics is available 48-96 hours after online publication and is updated daily on week days.
Initial download of the metrics may take a while.