Fig. 2.
Download original image
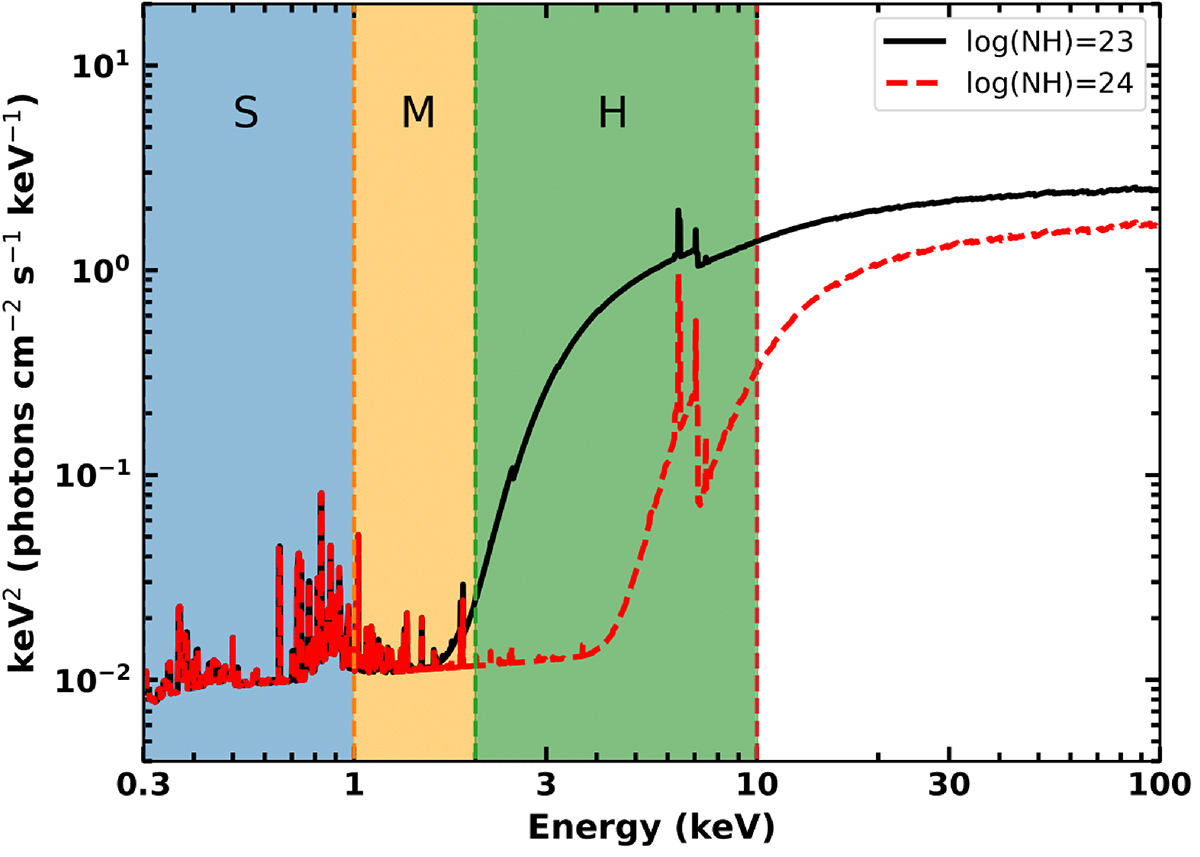
Simulated X-ray spectra of an AGN with line-of-sight column density Log(NH) = 23 (solid black line) and Log(NH) = 24 (dotted red line). The vertical regions denoted by S (blue), M (orange), and H (green) represent the different bands used in our two HRs and they correspond to the 0.3−1, 1−2, and 2−10 keV bands, respectively. The two spectra show extreme differences in the soft X-rays, particularly in the 2−10 keV band. Thus, HRs targeting this band are helpful in determining the column density of AGN.
Current usage metrics show cumulative count of Article Views (full-text article views including HTML views, PDF and ePub downloads, according to the available data) and Abstracts Views on Vision4Press platform.
Data correspond to usage on the plateform after 2015. The current usage metrics is available 48-96 hours after online publication and is updated daily on week days.
Initial download of the metrics may take a while.