Open Access
Fig. A.2.
Download original image
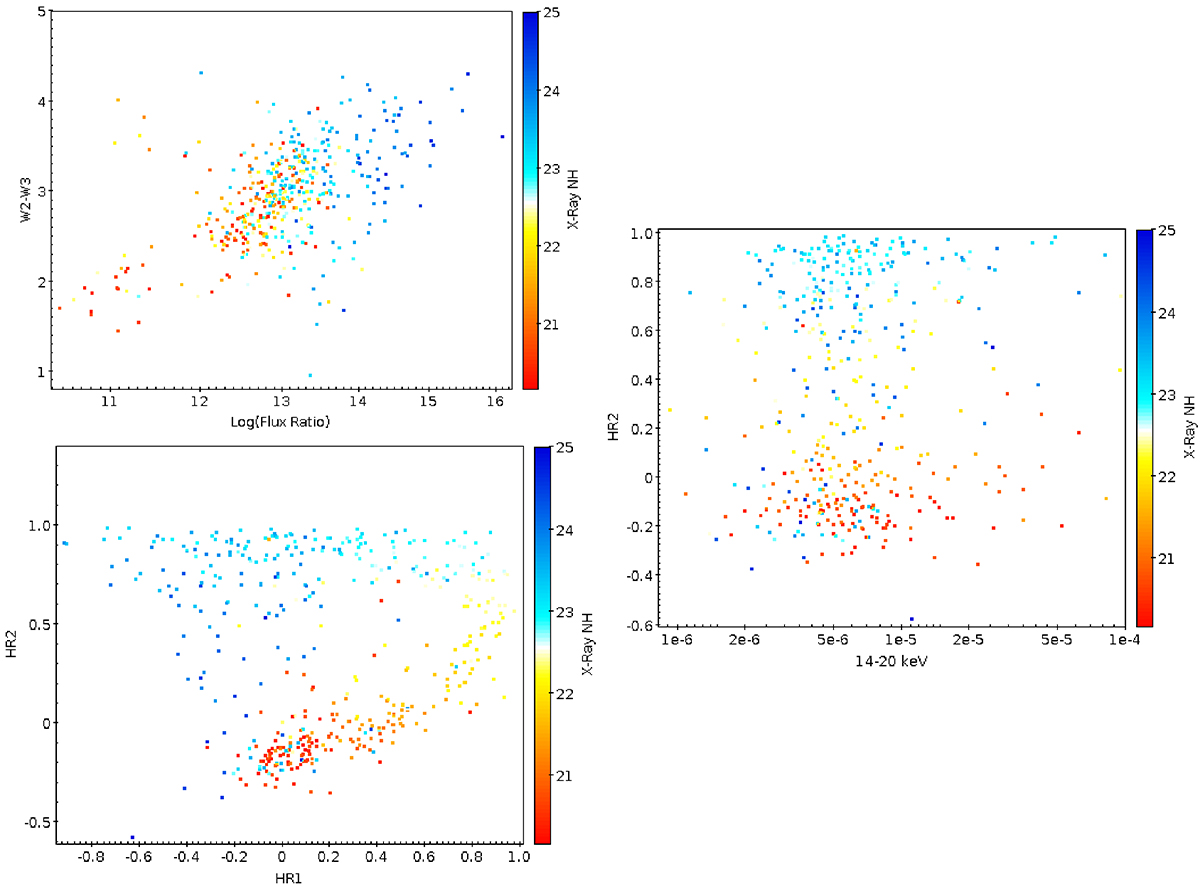
Parameter spaces between different input parameters, displaying how they can be used to predict column density. Top left: W2-W3 plotted against the MIR and X-ray flux ratio. Right: HR2 vs the 14–20 keV BAT count rate. Bottom left: HR2 vs HR1.
Current usage metrics show cumulative count of Article Views (full-text article views including HTML views, PDF and ePub downloads, according to the available data) and Abstracts Views on Vision4Press platform.
Data correspond to usage on the plateform after 2015. The current usage metrics is available 48-96 hours after online publication and is updated daily on week days.
Initial download of the metrics may take a while.