Fig. 7
Download original image
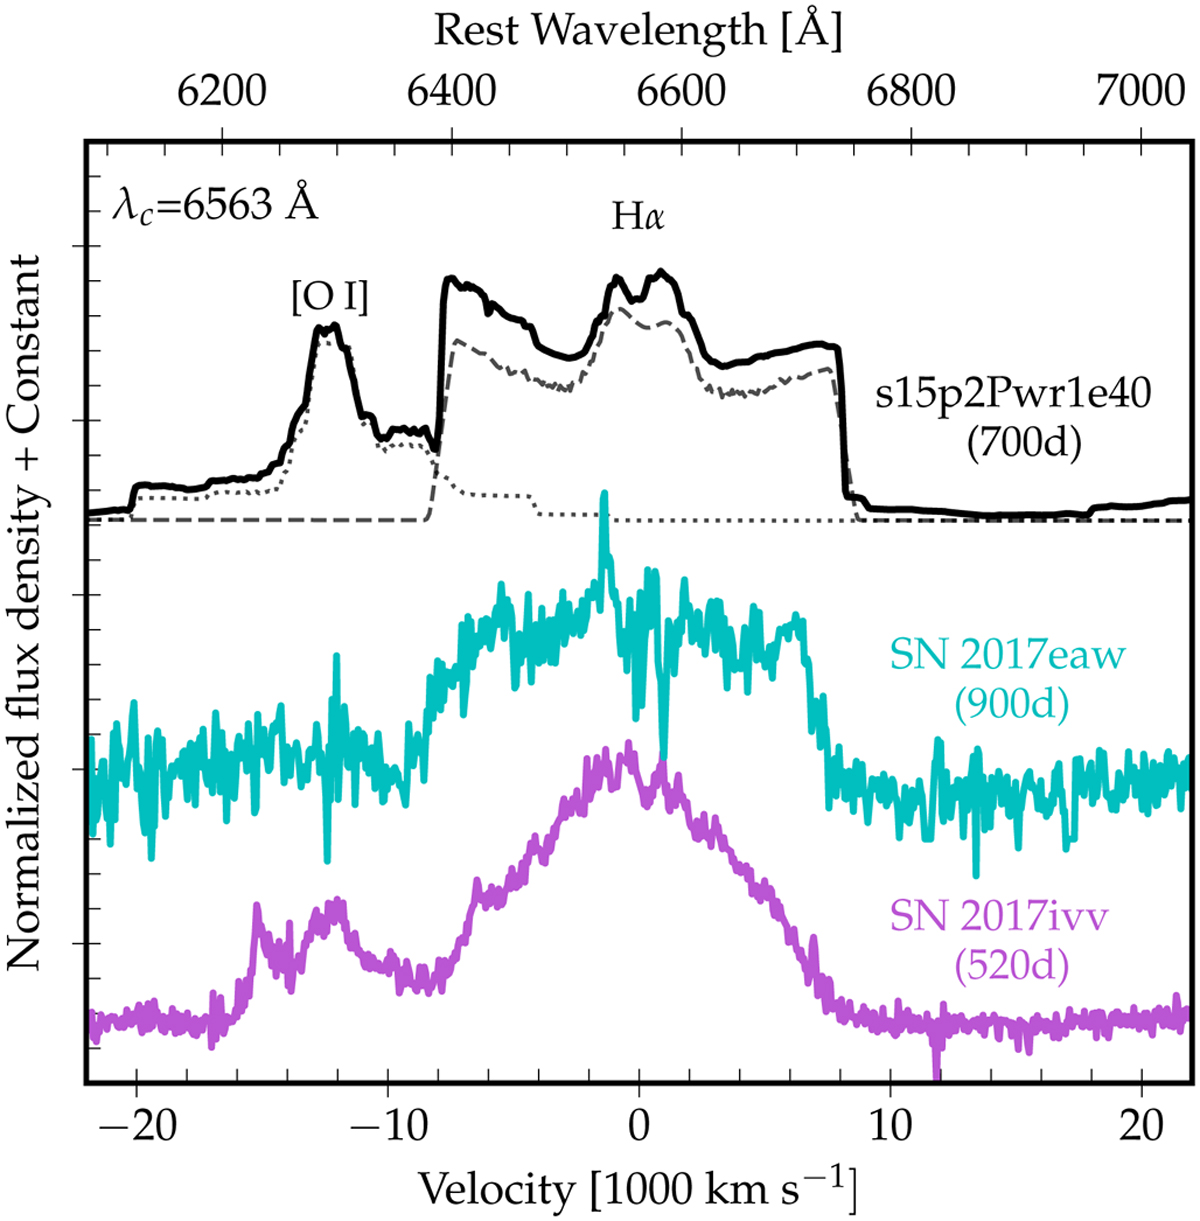
Illustration of some profile morphologies in model s15p2Pwr1e40 at 700 d together with the observations of SNe 2017eaw at 900 d and 2017ivv at 520 d. The spectral region shown is centered on the rest wavelength of Hα. At the top, the flux contributions associated with O I (dotted line; primarily associated with [O I] λλ 6300, 6364) and H I (dashed line; primarily associated with Hα) are shown. The residual flux offset in this spectral region is primarily due to a forest of Fe I and Fe II lines.
Current usage metrics show cumulative count of Article Views (full-text article views including HTML views, PDF and ePub downloads, according to the available data) and Abstracts Views on Vision4Press platform.
Data correspond to usage on the plateform after 2015. The current usage metrics is available 48-96 hours after online publication and is updated daily on week days.
Initial download of the metrics may take a while.