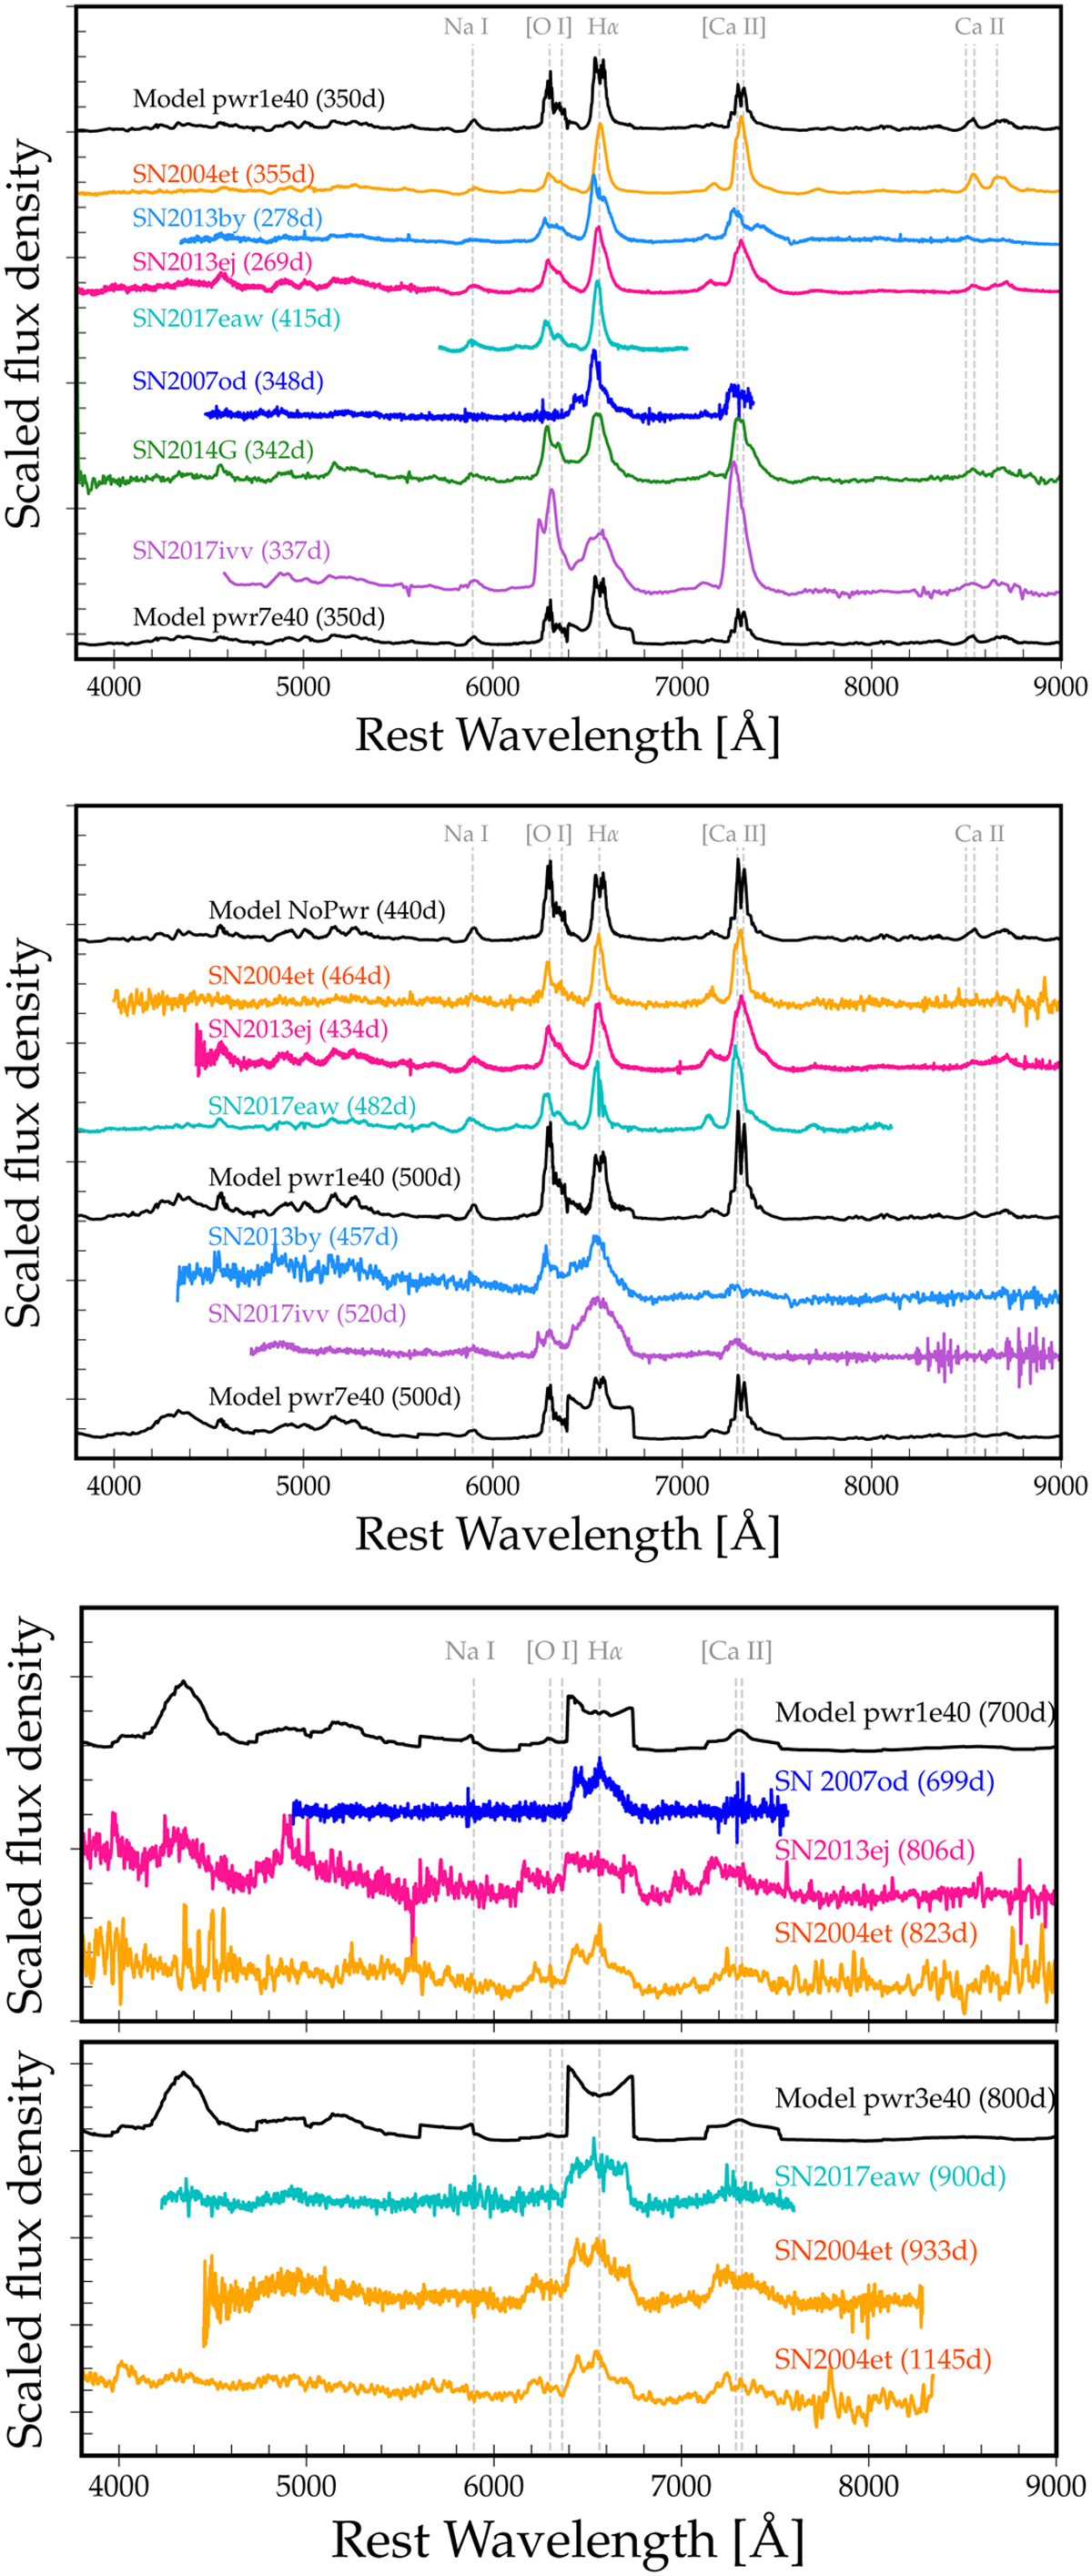
Fig. 6
Download original image
Spectral comparison between models and the selected sample of observations (see Table 2) at ~350 d (top panel), ~450 d (middle panel), and 800–1000 d (lower two panels). In each panel, we stacked models and observations in strengthening signs of interaction as we progress downwards. A distinct color is used for each SN while black is used for the models (see labels; light (dark) colors correspond to the original (smoothed) spectra). The galaxy lines were removed from the observed spectra, and the data were binned to reduce the noise.
Current usage metrics show cumulative count of Article Views (full-text article views including HTML views, PDF and ePub downloads, according to the available data) and Abstracts Views on Vision4Press platform.
Data correspond to usage on the plateform after 2015. The current usage metrics is available 48-96 hours after online publication and is updated daily on week days.
Initial download of the metrics may take a while.