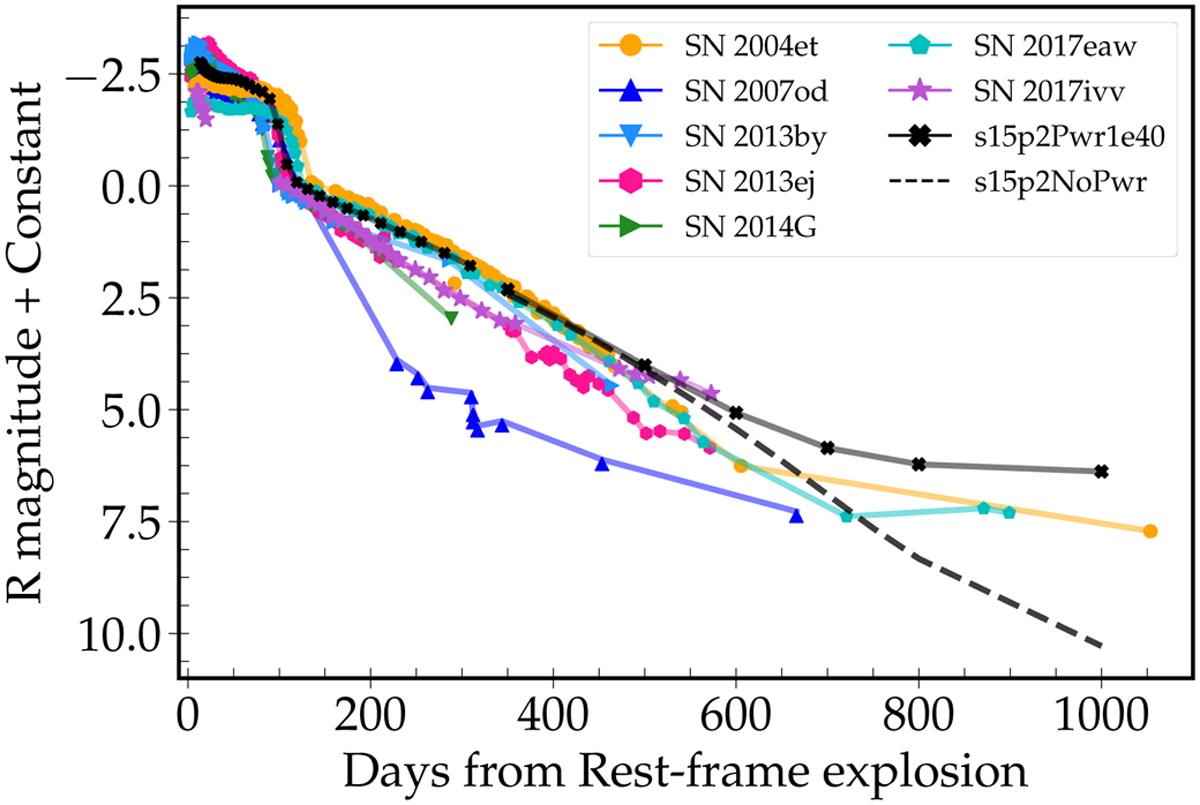
Fig. 5
Download original image
R-band light curves for model s15p2NoPwr and s15p2Pwr1e40 compared with a set of observations (for a few objects, we show the r-band magnitude instead; see Table 2). All light curves are shifted so that the magnitude is zero at the onset of the nebular phase (when the fall from the plateau stops and the SN initially follows the rate of 56Co decay).
Current usage metrics show cumulative count of Article Views (full-text article views including HTML views, PDF and ePub downloads, according to the available data) and Abstracts Views on Vision4Press platform.
Data correspond to usage on the plateform after 2015. The current usage metrics is available 48-96 hours after online publication and is updated daily on week days.
Initial download of the metrics may take a while.