Fig. 4
Download original image
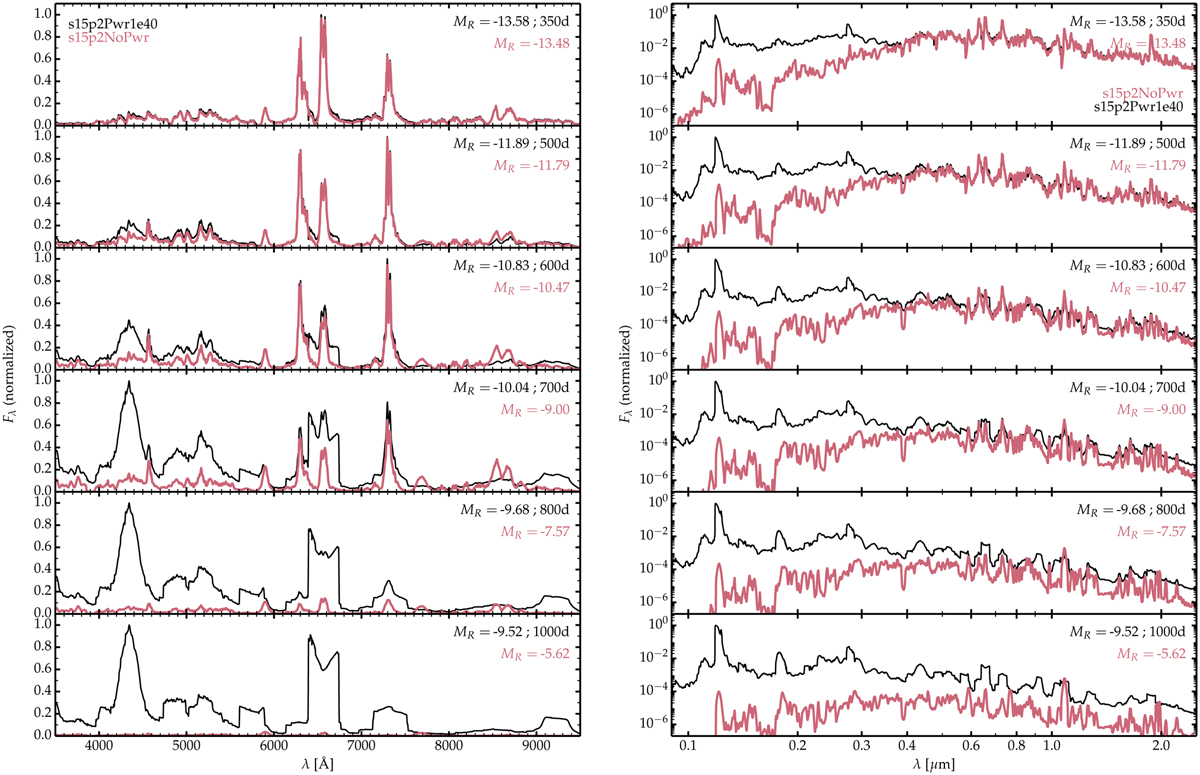
Comparison of multiepoch, normalized spectra from 350 d to 1000 d between models s15p2NoPwr (red) and s15p2Pwr1e40 (black) over the optical range (left) and over the UV, optical, and near-IR ranges (right; flux density is shown on a log scale). The same normalization factor is applied to both models at each epoch in order to preserve the relative offset between the spectra.
Current usage metrics show cumulative count of Article Views (full-text article views including HTML views, PDF and ePub downloads, according to the available data) and Abstracts Views on Vision4Press platform.
Data correspond to usage on the plateform after 2015. The current usage metrics is available 48-96 hours after online publication and is updated daily on week days.
Initial download of the metrics may take a while.