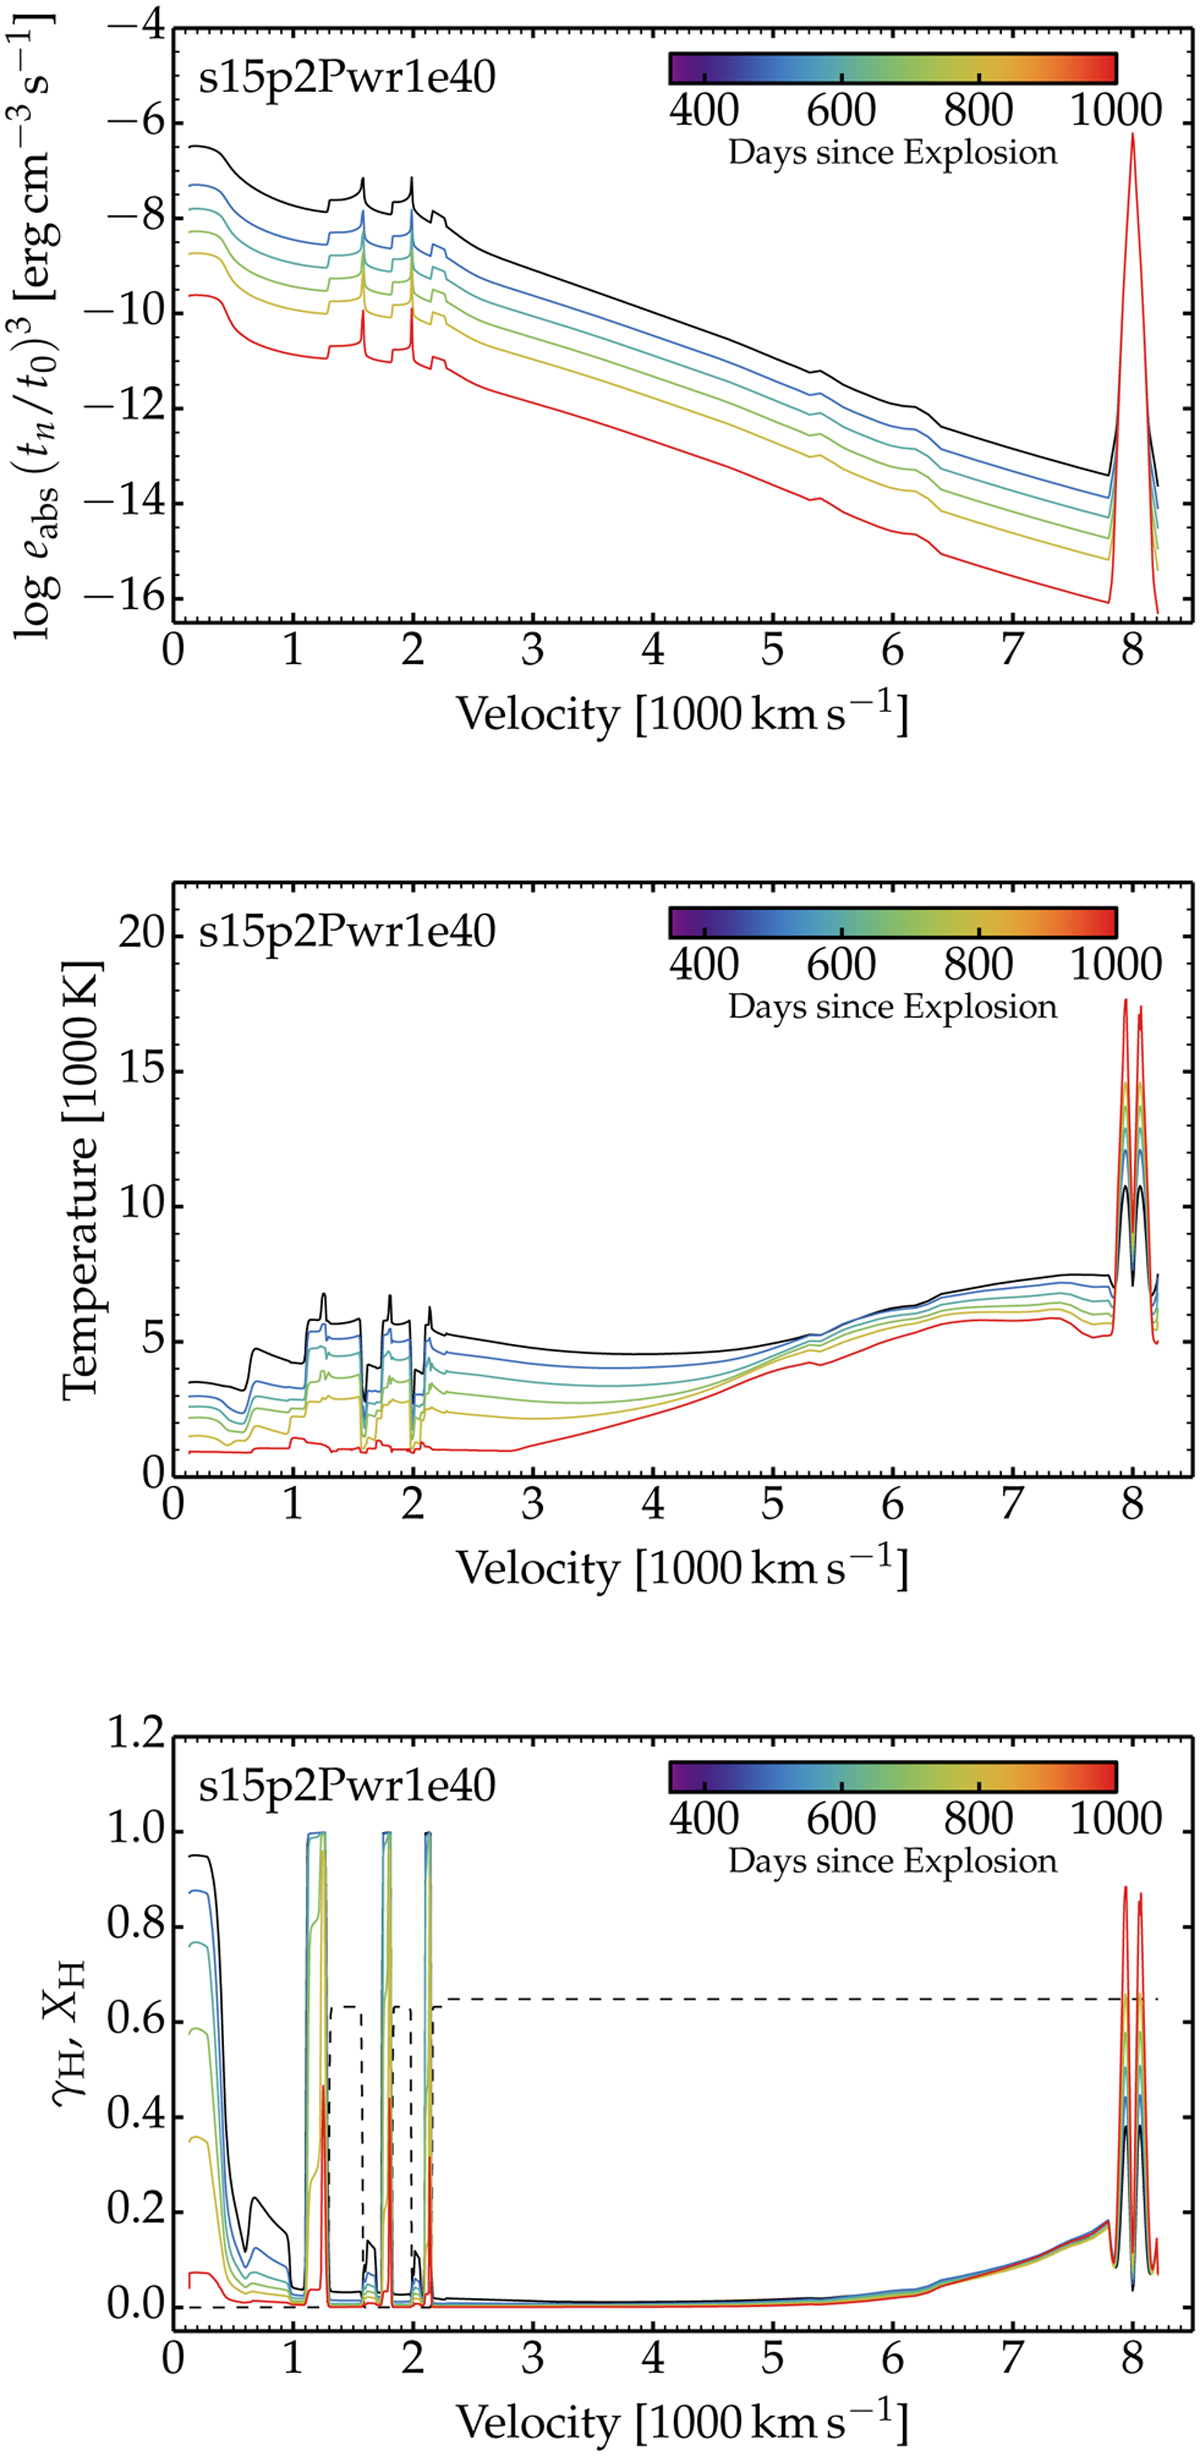
Fig. 2
Download original image
Evolution of ejecta properties for model s15p2Pwr1e40 from t0 = 350 to 1000 d. From top to bottom, we show the profile of the total power absorbed (scaled to counter the effect of expansion; see text), of the gas temperature, and of the hydrogen ionization. In the bottom panel, we overplot the hydrogen mass fraction (dashed line).
Current usage metrics show cumulative count of Article Views (full-text article views including HTML views, PDF and ePub downloads, according to the available data) and Abstracts Views on Vision4Press platform.
Data correspond to usage on the plateform after 2015. The current usage metrics is available 48-96 hours after online publication and is updated daily on week days.
Initial download of the metrics may take a while.