Fig. A.3
Download original image
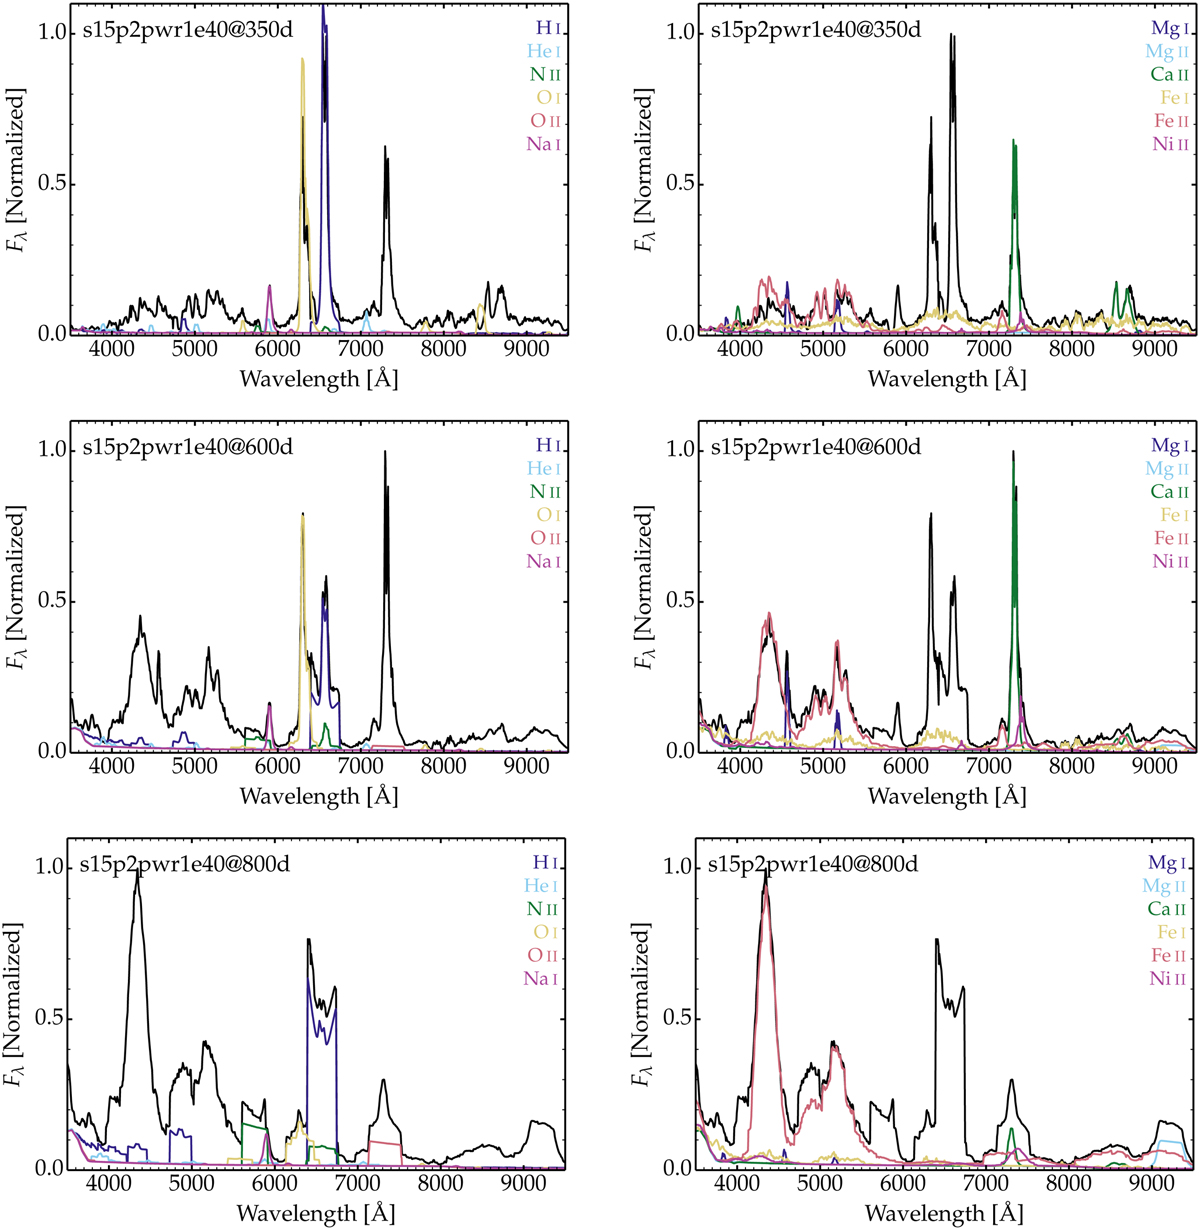
Line contributions to the full spectrum for model s15p2Pwr1e40 at 350 (top row), 600 (middle row), and 800 d (bottom row). In each row, we show the total normalized flux density as a black line together with the flux from individual ions (the same normalization is applied to all spectra) including H I, He I, N II, O I, O II, Na I, Mg I, Mg II, Ca II, Fe I, Fe II, and Ni II. For better visibility, we split the species into two groups and as many panels (at left and at right in each row).
Current usage metrics show cumulative count of Article Views (full-text article views including HTML views, PDF and ePub downloads, according to the available data) and Abstracts Views on Vision4Press platform.
Data correspond to usage on the plateform after 2015. The current usage metrics is available 48-96 hours after online publication and is updated daily on week days.
Initial download of the metrics may take a while.