Fig. 1
Download original image
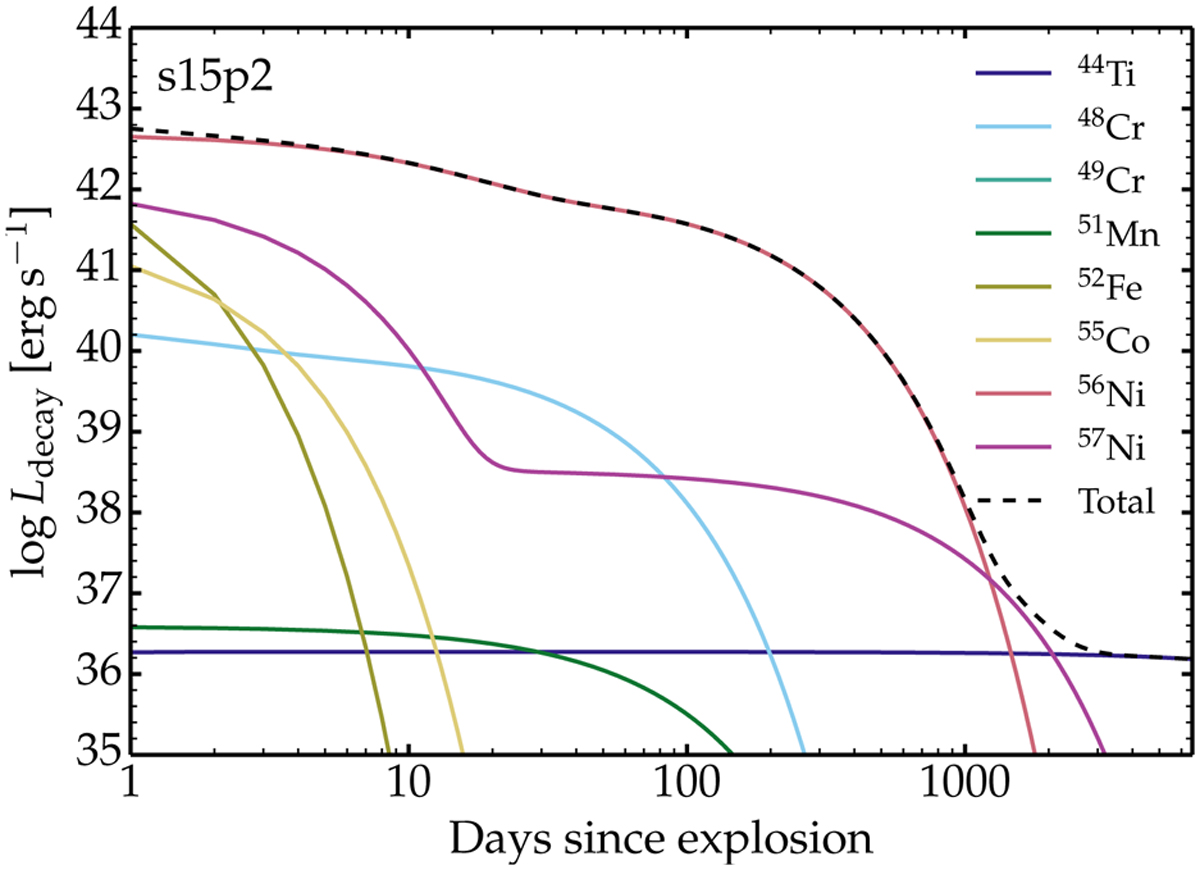
Emitted decay power as a function of time since explosion in model s15p2 (see Table 1 for the yields). We show the individual contributions from the dominant unstable isotopes (the label refers to the parent isotope of the two-step decay chains) as colored curves, with the total given by the black dashed curve. Because of γ-ray escape, the power effectively absorbed by the ejecta is only a fraction of the power emitted (about 25% at 1000 d in this model). The dominant source of power is 56Ni in the first 1000 d, while 44Ti takes over beyond about 3000 d. Evidently, ejecta interaction with a standard RSG wind, which delivers a power of about 1040 erg s−1 would dominate over radioactive decay after about 600 d.
Current usage metrics show cumulative count of Article Views (full-text article views including HTML views, PDF and ePub downloads, according to the available data) and Abstracts Views on Vision4Press platform.
Data correspond to usage on the plateform after 2015. The current usage metrics is available 48-96 hours after online publication and is updated daily on week days.
Initial download of the metrics may take a while.