Fig. 3.
Download original image
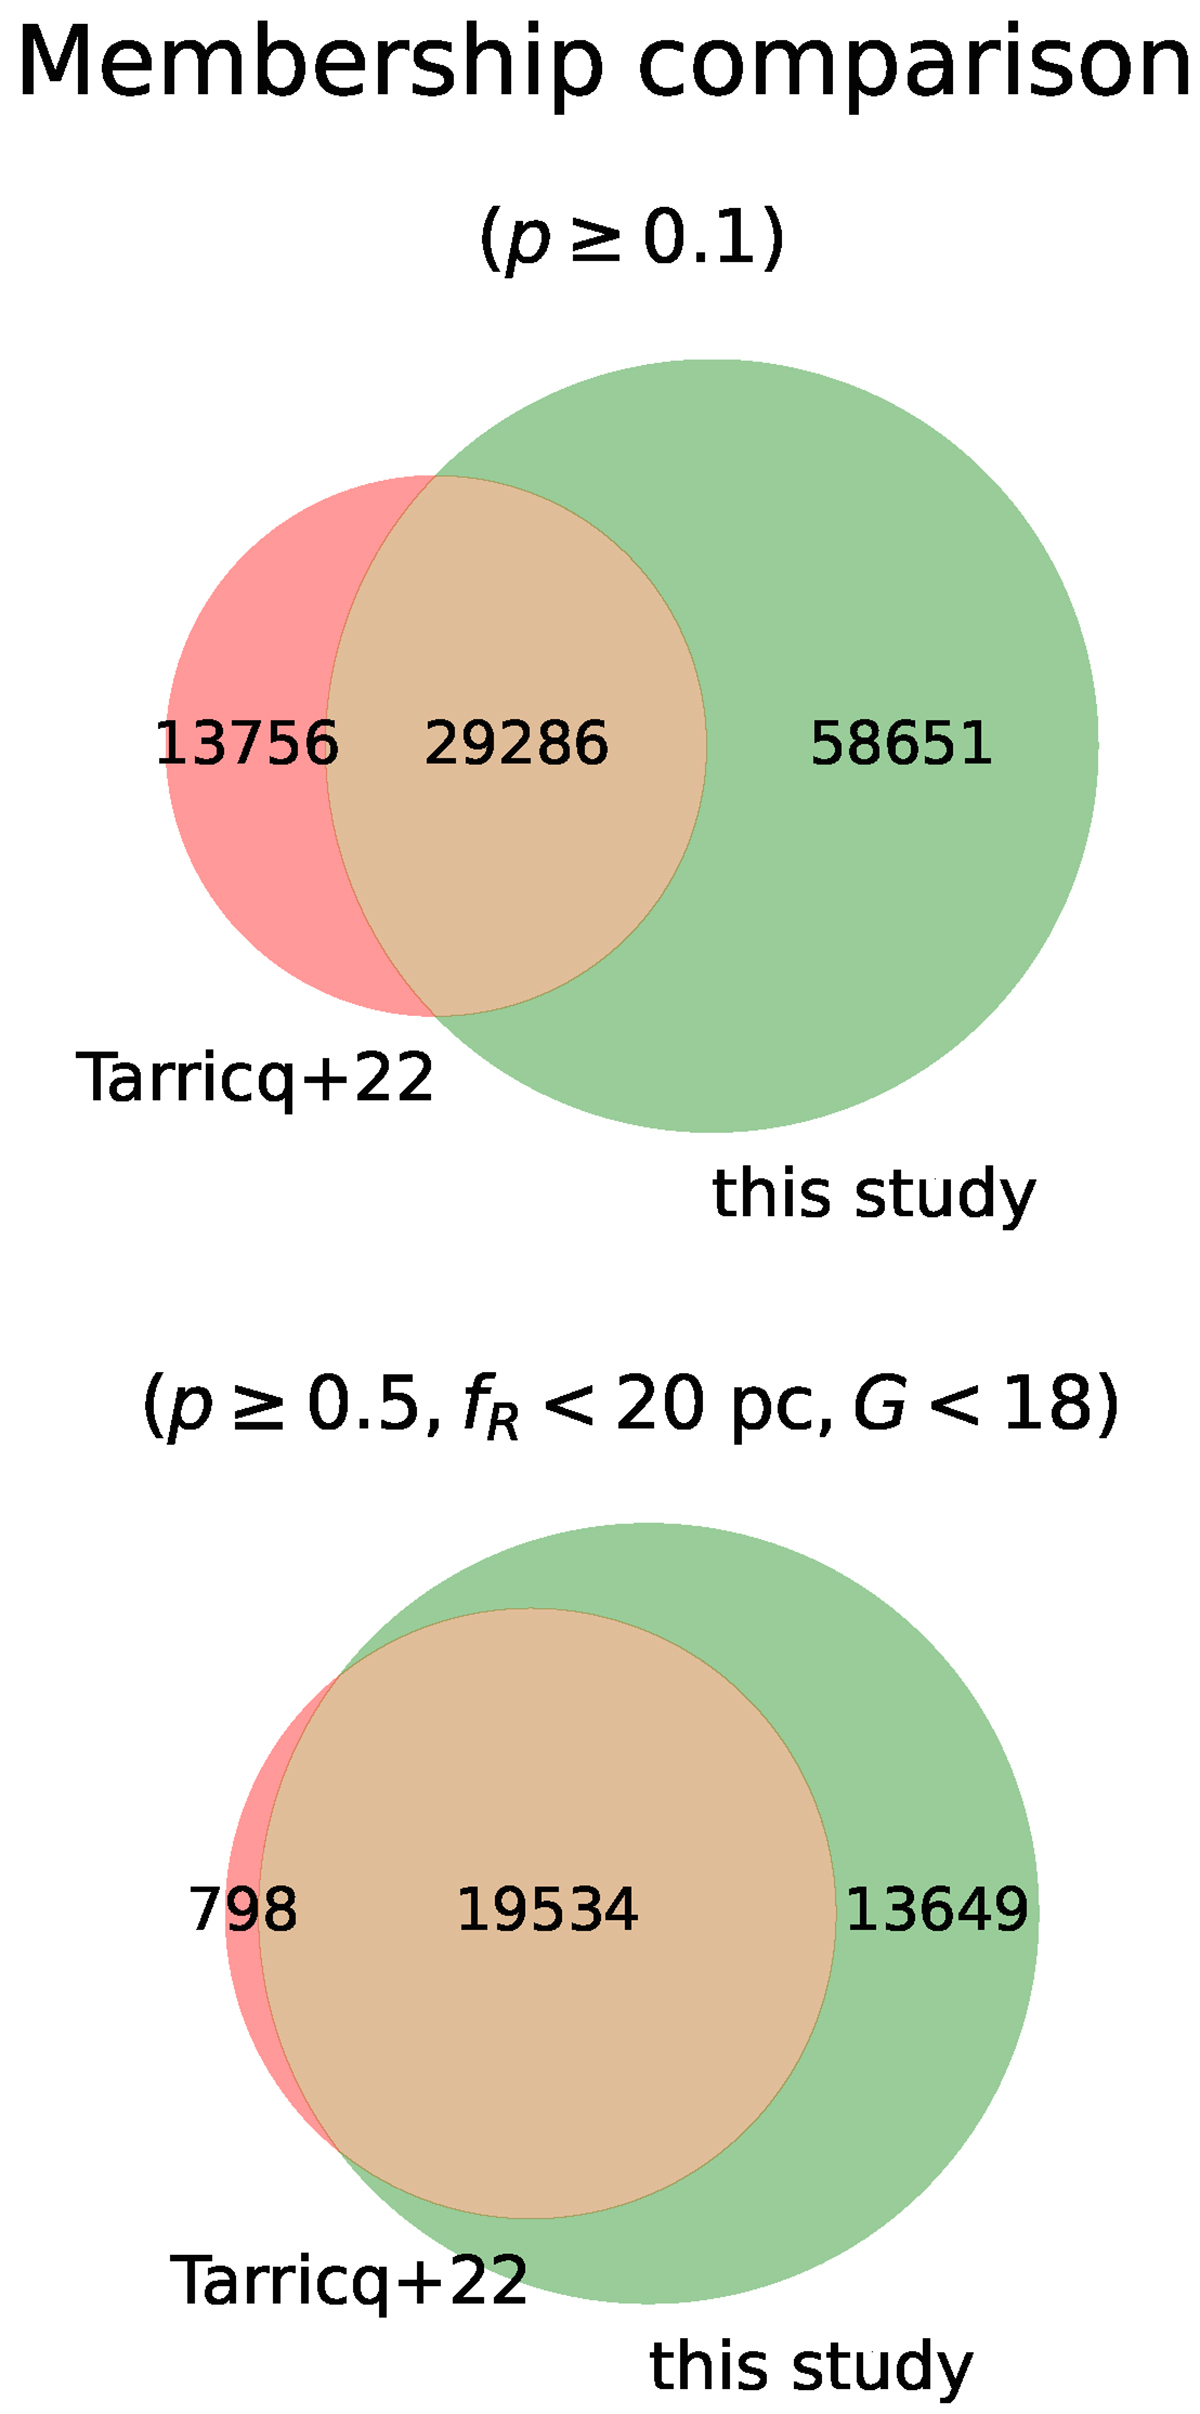
Venn diagrams comparing the combined membership lists of the 167 test OCs from T22 and this study. The top figure compares the members with a membership probability of p ≥ 0.1, while the bottom figure compares the members with a membership probability of p ≥ 0.5, a projected radius of less than 20 pc, and a G-magnitude of brighter than 18. The members that only occur in T22 are labelled in red, those that only occur in this study are in green, and the overlapping members are labelled in orange.
Current usage metrics show cumulative count of Article Views (full-text article views including HTML views, PDF and ePub downloads, according to the available data) and Abstracts Views on Vision4Press platform.
Data correspond to usage on the plateform after 2015. The current usage metrics is available 48-96 hours after online publication and is updated daily on week days.
Initial download of the metrics may take a while.