Fig. 2.
Download original image
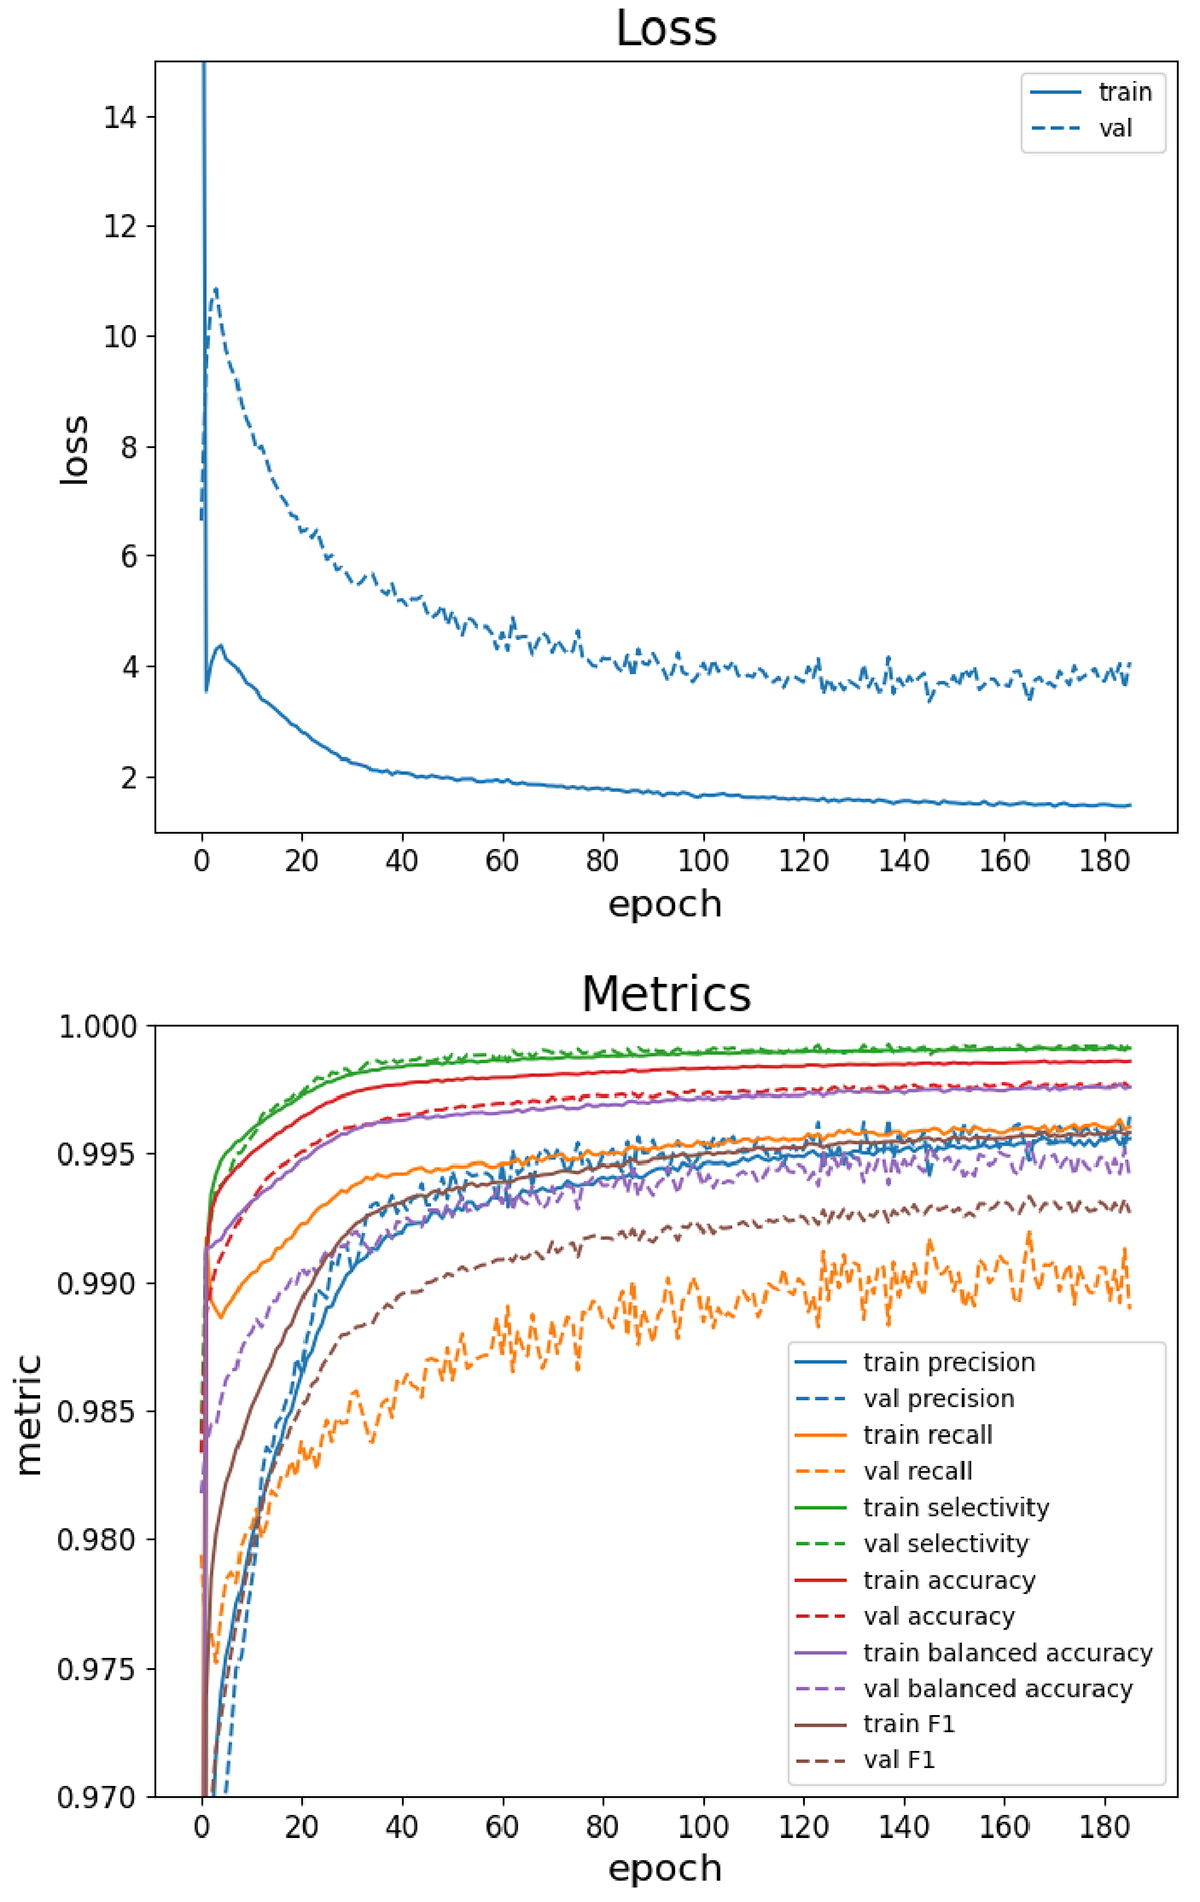
Performance of the DS model during training. The top figure shows the evolution of the loss function (Eq. (19)) for the training and validation set. The bottom figure shows the evolution of a number of classification metrics based on the number of true positives TP, true negatives TN, false positives FP, and false negatives FN, including: precision ![]() , recall
, recall ![]() , selectivity
, selectivity ![]() , accuracy
, accuracy ![]() , balanced accuracy (average of recall and selectivity), and F1-score (harmonic mean of recall and precision). After 165 epochs, the model has reached its maximum validation F1-score.
, balanced accuracy (average of recall and selectivity), and F1-score (harmonic mean of recall and precision). After 165 epochs, the model has reached its maximum validation F1-score.
Current usage metrics show cumulative count of Article Views (full-text article views including HTML views, PDF and ePub downloads, according to the available data) and Abstracts Views on Vision4Press platform.
Data correspond to usage on the plateform after 2015. The current usage metrics is available 48-96 hours after online publication and is updated daily on week days.
Initial download of the metrics may take a while.