Fig. 5.
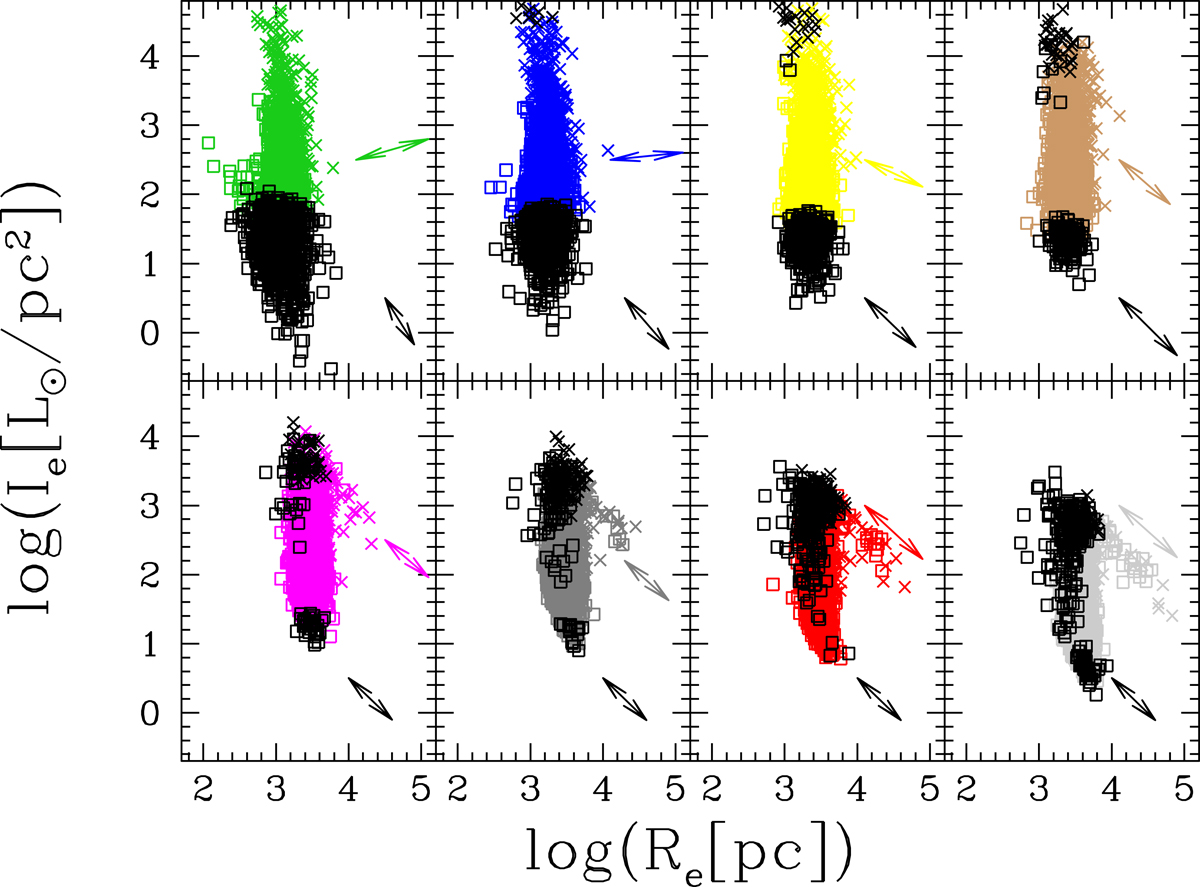
Download original image
The Ie − Re plane at different redshift for Illutris-1. From top left to bottom right, we can see the distribution of galaxies at z = 4, z = 3, z = 2.2, z = 1.6, z = 1.0, z = 0.6, z = 0.2, and z = 0. The colored dots mark the galaxies with β > 0 at each epoch, whereas the black symbols mark those with β ≤ 0. The crosses mark the galaxies with SFR greater than the mean ⟨SFR⟩ at each epoch, while the open squares show those with SFR lower than ⟨SFR⟩. The arrows indicate the average direction of motion predicted on the basis of the values of β from Eq. (3); see also Table 1. The colored arrows mark the average for the galaxies with β > 0 and the black arrows those with β ≤ 0. Their length is not related or proportional to any other quantity; it was chosen for graphical reasons.
Current usage metrics show cumulative count of Article Views (full-text article views including HTML views, PDF and ePub downloads, according to the available data) and Abstracts Views on Vision4Press platform.
Data correspond to usage on the plateform after 2015. The current usage metrics is available 48-96 hours after online publication and is updated daily on week days.
Initial download of the metrics may take a while.