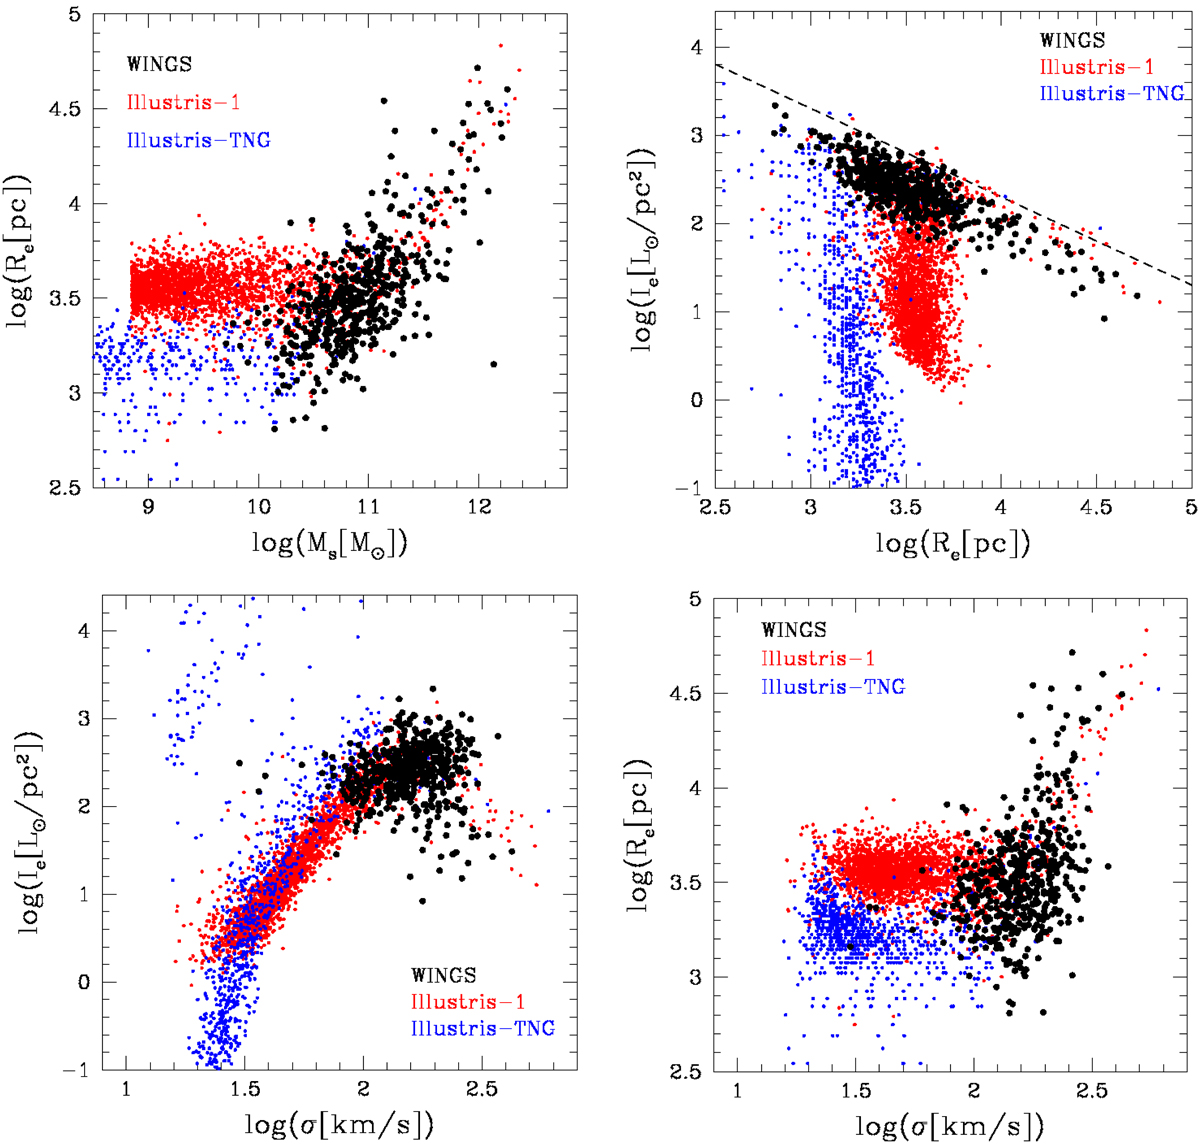
Fig. 3.
Download original image
The Re − M* plane and the three different projections of the FP. The black dots are the WINGS observational data. The red and blue dots are the data extracted from Illustris-1 and Illustris TNG-100, respectively. The galaxies with log(Re) < 2.5 are not plotted here in order to better show the bulk of the galaxy distribution.
Current usage metrics show cumulative count of Article Views (full-text article views including HTML views, PDF and ePub downloads, according to the available data) and Abstracts Views on Vision4Press platform.
Data correspond to usage on the plateform after 2015. The current usage metrics is available 48-96 hours after online publication and is updated daily on week days.
Initial download of the metrics may take a while.