Fig. A.2.
Download original image
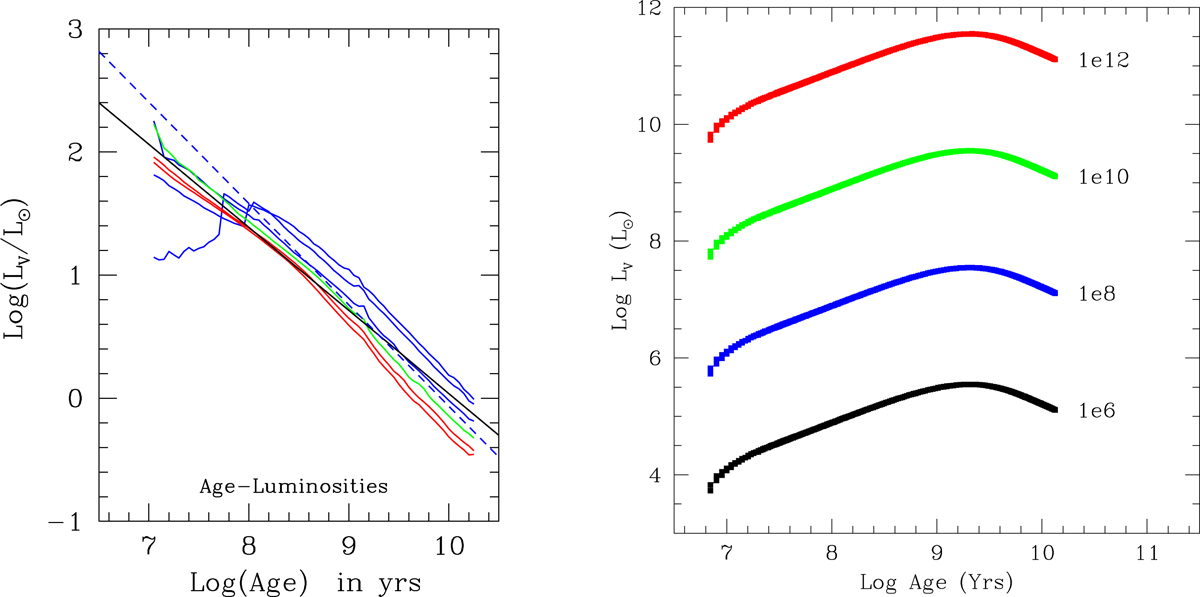
Luminosity in L⊙ vs time in years of SSPs (left panel) with the Salpeter IMF (in number of stars per mass interval) with exponent -2.5 and total SSP mass of 5.826 M⊙. The chemical compositions of the SSPs and associated color code are the same as in Fig. A.1. Model galaxies with infall calculated by the authors (right panel). The color code indicates the total baryonic mass of the galaxy in M⊙ whose value is also displayed in the label of each curve. The timescale of gas infall is τ = 1 Gyr. The peak in luminosity corresponds to the maximum SFR. The galaxy models are described by D’Onofrio & Chiosi (2023).
Current usage metrics show cumulative count of Article Views (full-text article views including HTML views, PDF and ePub downloads, according to the available data) and Abstracts Views on Vision4Press platform.
Data correspond to usage on the plateform after 2015. The current usage metrics is available 48-96 hours after online publication and is updated daily on week days.
Initial download of the metrics may take a while.