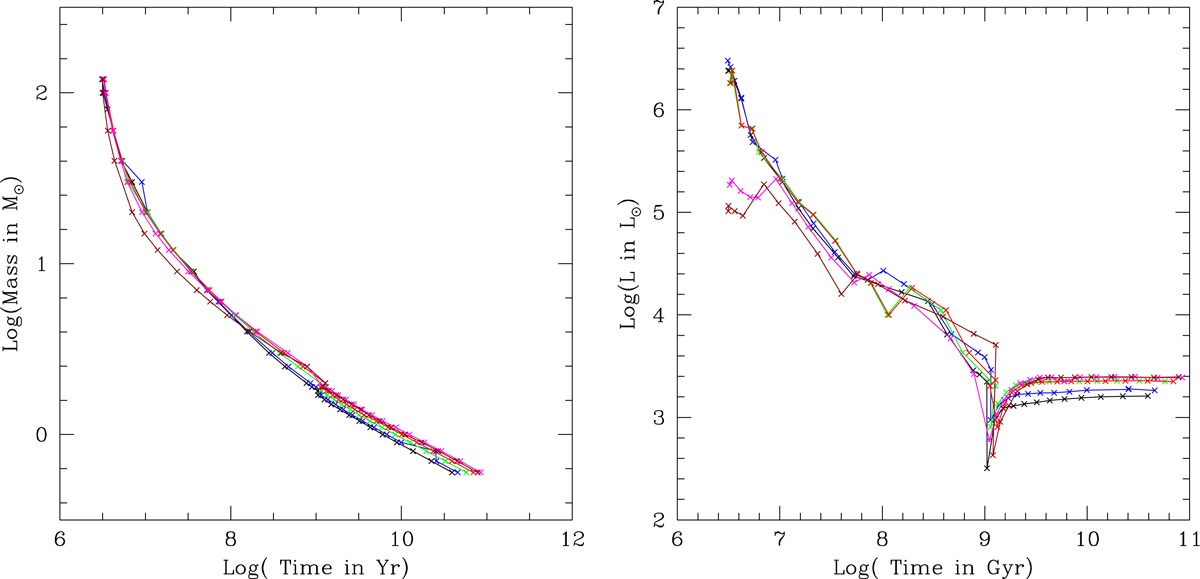
Fig. A.1.
Download original image
Stellar mass in M⊙ vs age in years (left panel). The asterisks along each curve are the star masses in the mass interval 0.6 to 120 M⊙. The color code of each curve indicates the chemical composition. Curves are also labeled in accordance with the mass abundance of metals Z according to the law ΔY/ΔZ = 2.5, where Y is the mass abundance of helium and the initial values are Z0 = 0.0001 and Y0 = 0.23. The values of the metalliciies are Z = 0.0001 (black), Z = 0.0004 (blue), Z = 0.004 (green), Z = 0.008 (magenta), Z = 0.020 (red), and Z = 0.050 (dark red). The mass abundance of hydrogen is given by X = 1 − Y − Z. Same as in the left panel but for luminosity vs age (right panel). The luminosity dips at ages above 1 to 1.5 Gyr correspond to the transition masses MHeF. Along each curve, stars more massive than MHeF undergo a quite He-ignition of the core, while those equal or lighter than MHeF undergo core He-flash.
Current usage metrics show cumulative count of Article Views (full-text article views including HTML views, PDF and ePub downloads, according to the available data) and Abstracts Views on Vision4Press platform.
Data correspond to usage on the plateform after 2015. The current usage metrics is available 48-96 hours after online publication and is updated daily on week days.
Initial download of the metrics may take a while.