Open Access
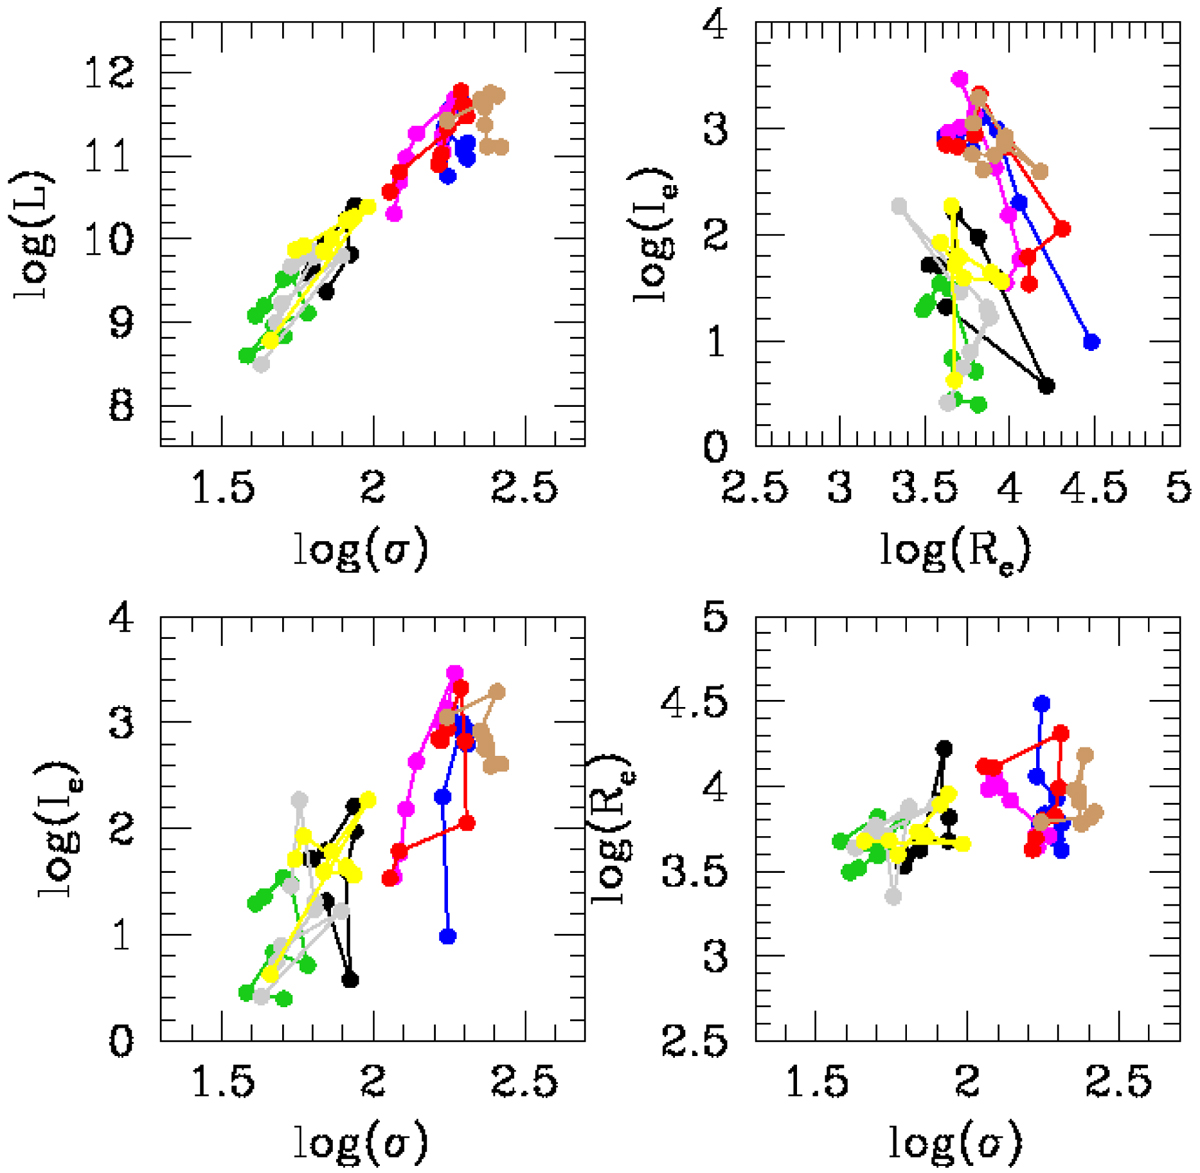
Fig. 18.
Download original image
The SSRs for eight single galaxies. The different colors mark the single galaxies. The positions in the diagram connected by the colored lines mark the distribution at different redshift epochs.
Current usage metrics show cumulative count of Article Views (full-text article views including HTML views, PDF and ePub downloads, according to the available data) and Abstracts Views on Vision4Press platform.
Data correspond to usage on the plateform after 2015. The current usage metrics is available 48-96 hours after online publication and is updated daily on week days.
Initial download of the metrics may take a while.