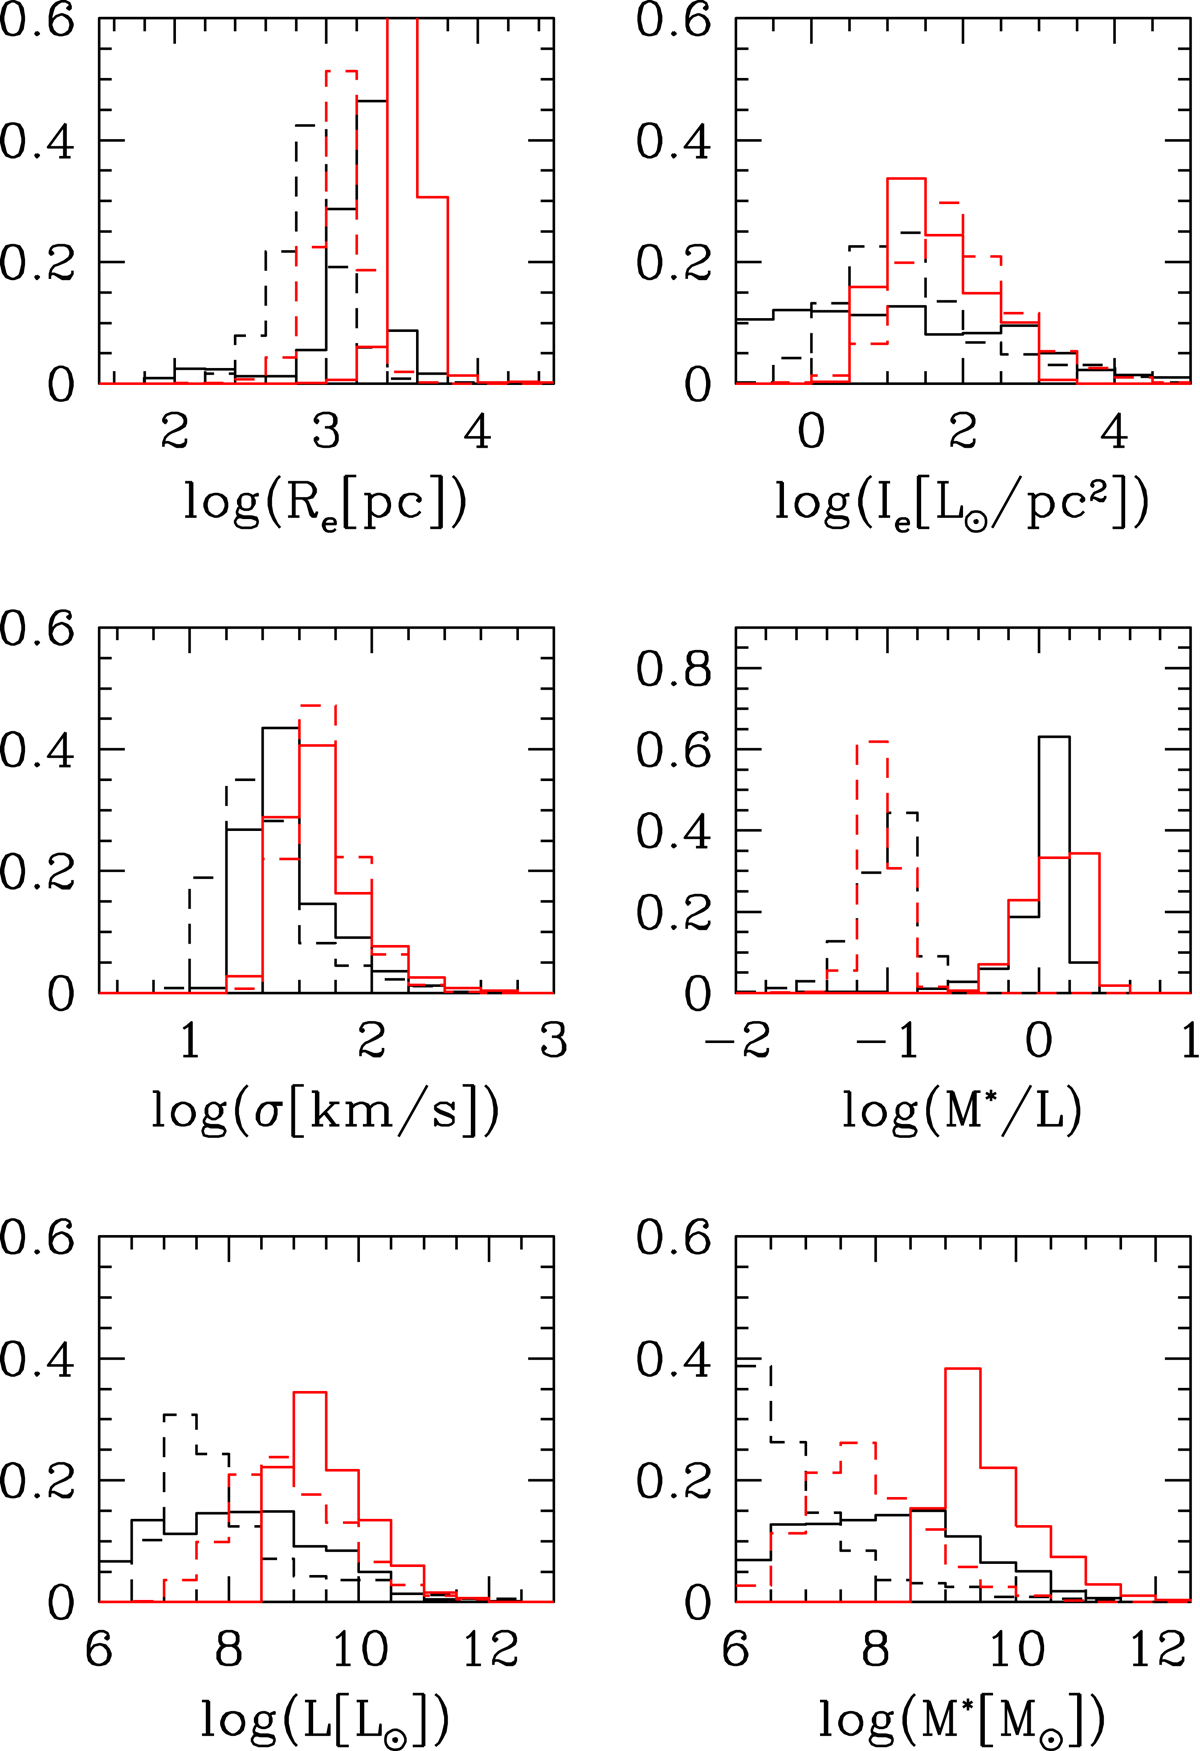
Fig. 1.
Download original image
Comparison between the data of Illustris-1 and Illustris-TNG100. The black lines mark the TNG data, while the red ones the Illustris-1 data. The solid line refers to the data at z = 0, while the dashed lines to the data at z = 4. From top left to bottom right we show: the effective radius Re (enclosing half the total luminosity or half the total stellar mass (for TNG); the effective surface brightness Ie; the central star velocity dispersion σ; the stellar mass-to-light ratio (M*/L); the total luminosity (in solar units); and the total stellar mass (in solar units).
Current usage metrics show cumulative count of Article Views (full-text article views including HTML views, PDF and ePub downloads, according to the available data) and Abstracts Views on Vision4Press platform.
Data correspond to usage on the plateform after 2015. The current usage metrics is available 48-96 hours after online publication and is updated daily on week days.
Initial download of the metrics may take a while.