Open Access
Fig. 6.
Download original image
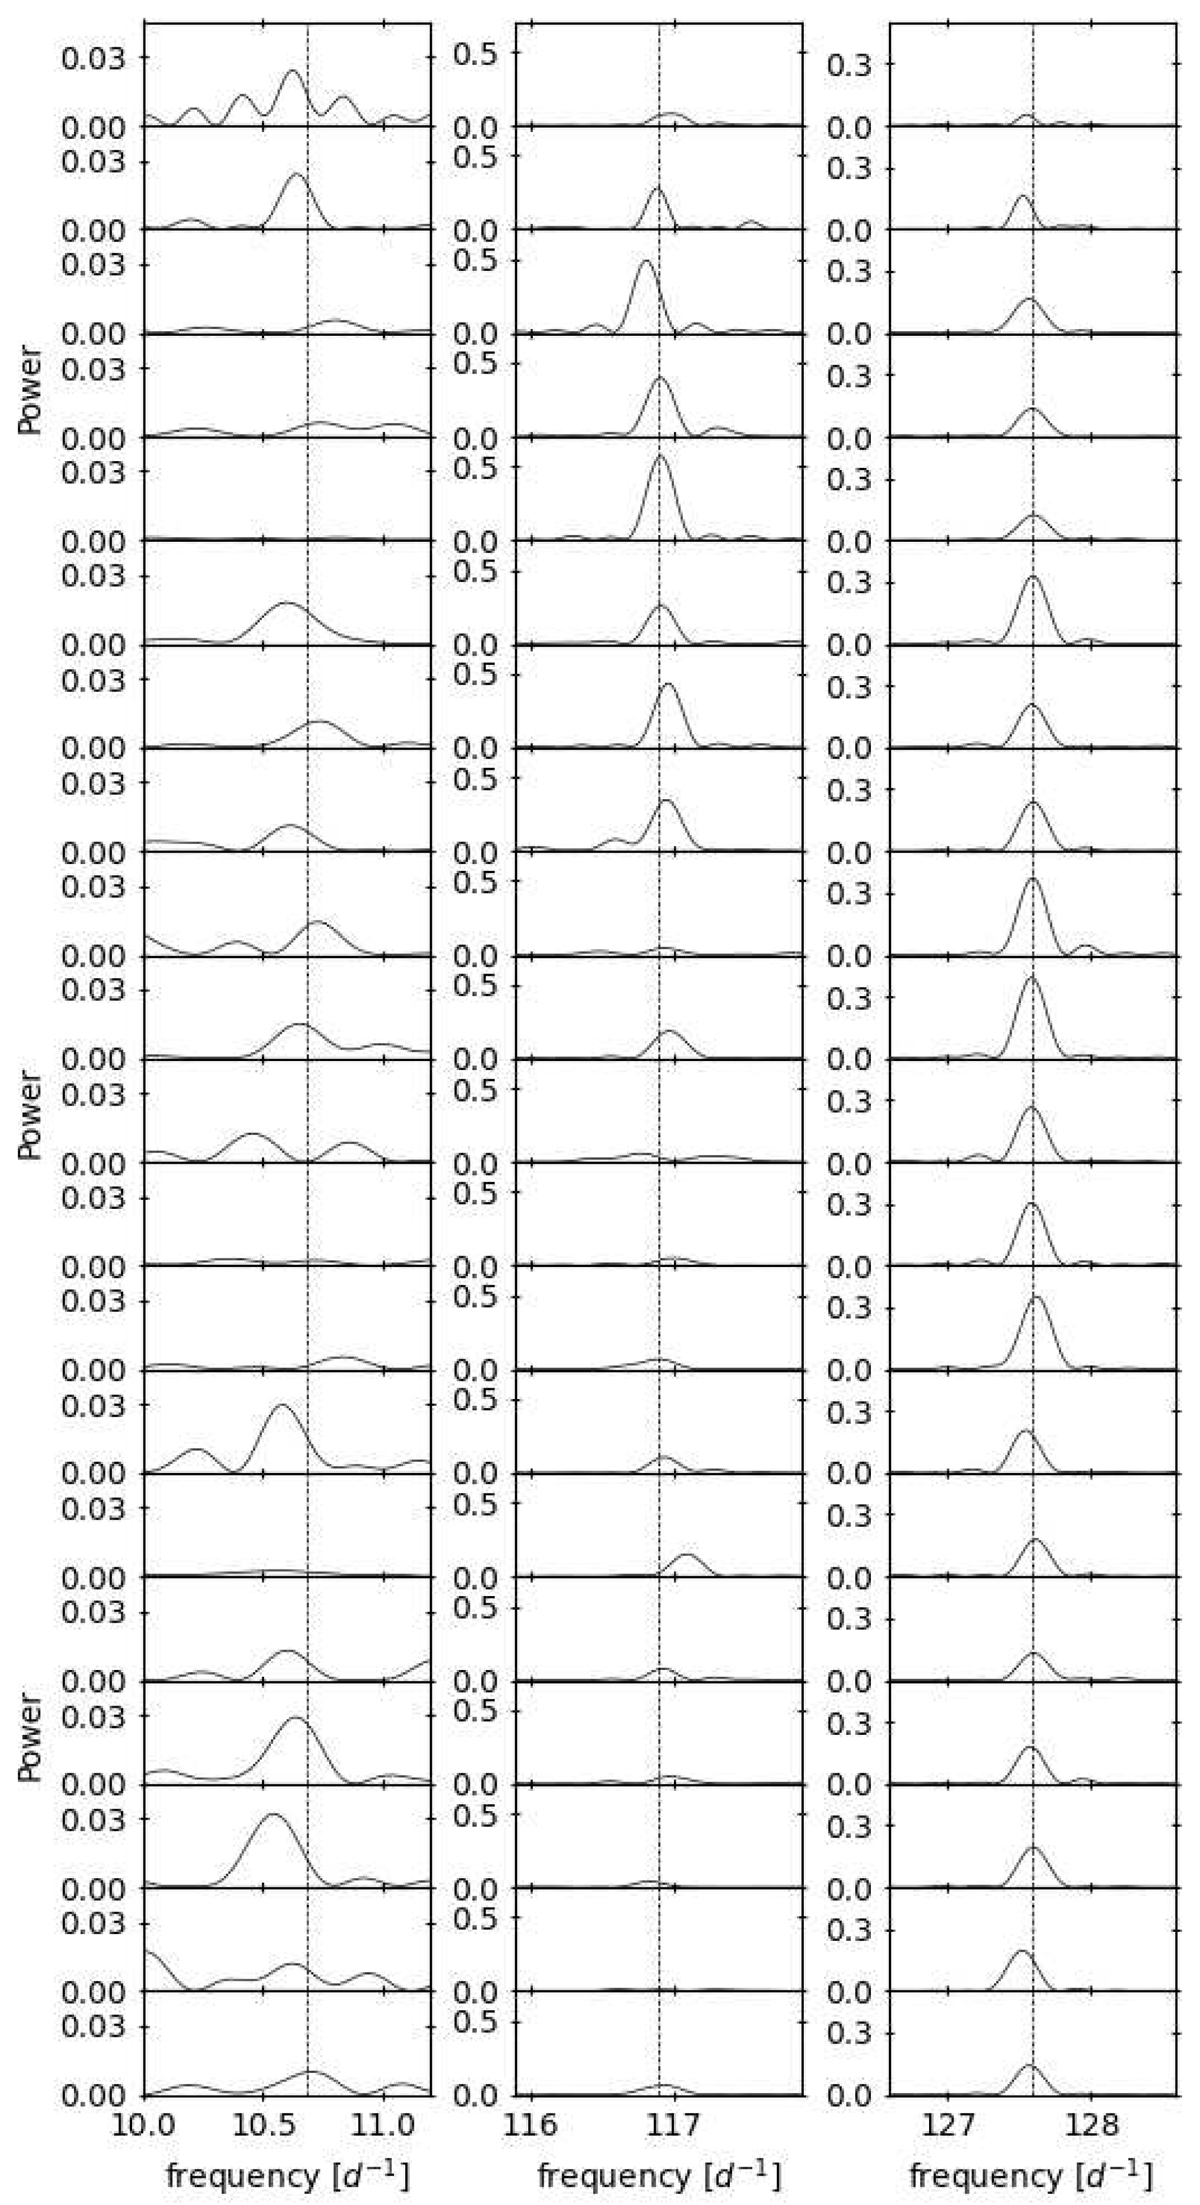
LS periodogram per portion, obtained by dividing the Kepler light curve into 20 equally spaced sub-samples. The first column represents f0, the second f1, and the third f2. The vertical lines indicate the mean value of f1 and f2, or Δ when f0 was computed as the difference between the two frequencies.
Current usage metrics show cumulative count of Article Views (full-text article views including HTML views, PDF and ePub downloads, according to the available data) and Abstracts Views on Vision4Press platform.
Data correspond to usage on the plateform after 2015. The current usage metrics is available 48-96 hours after online publication and is updated daily on week days.
Initial download of the metrics may take a while.