Open Access
Fig. 3.
Download original image
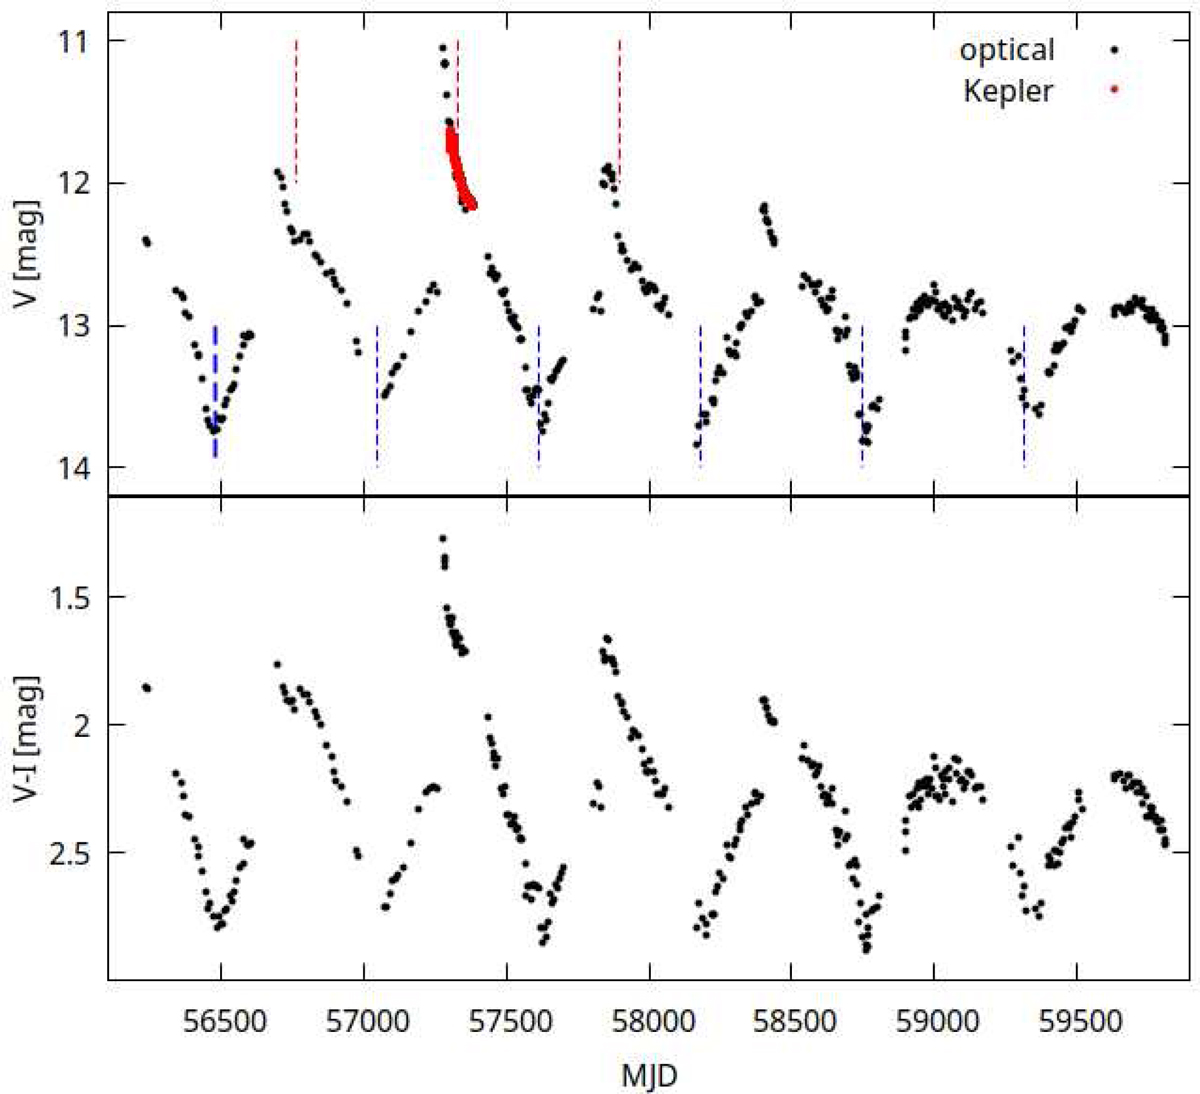
Selected time interval of V light curve from Fig. 1, and corresponding V − I index. The blue and red dashed lines correspond to the inferior and superior conjunction of the red giant, respectively. The blue thick dashed line is the reference optical minimum determined by polynomial fitting.
Current usage metrics show cumulative count of Article Views (full-text article views including HTML views, PDF and ePub downloads, according to the available data) and Abstracts Views on Vision4Press platform.
Data correspond to usage on the plateform after 2015. The current usage metrics is available 48-96 hours after online publication and is updated daily on week days.
Initial download of the metrics may take a while.