Open Access
Fig. 1.
Download original image
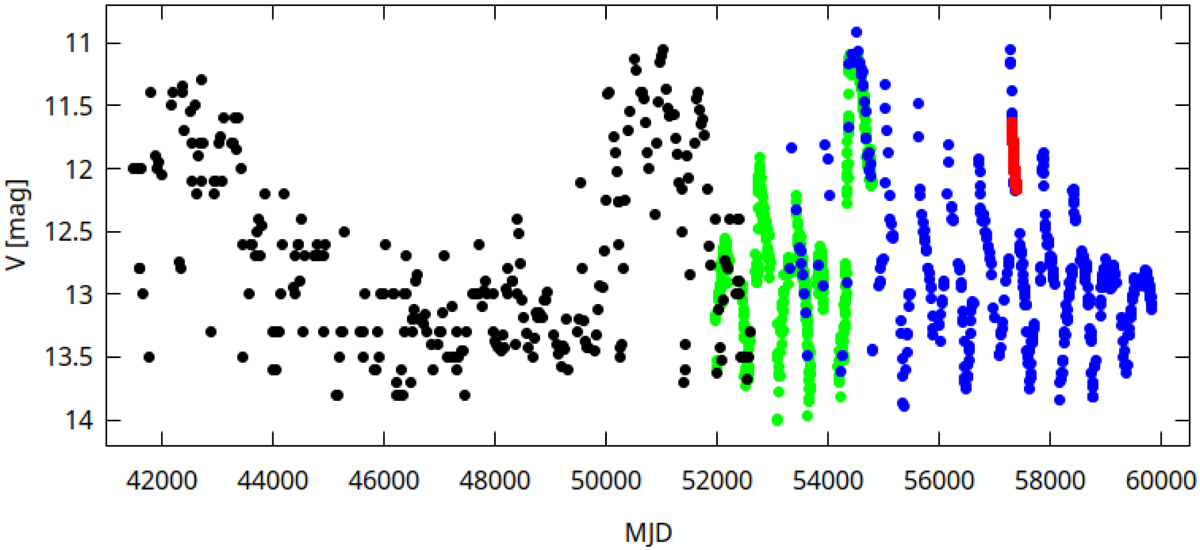
Optical light curve of FN Sgr. Data from (Brandi et al. 2005) are shown in black, the ASAS data in green, and our new data in blue. The Kepler light curve is also shown in red, offset vertically by 12 mag for comparison with the V-band data.
Current usage metrics show cumulative count of Article Views (full-text article views including HTML views, PDF and ePub downloads, according to the available data) and Abstracts Views on Vision4Press platform.
Data correspond to usage on the plateform after 2015. The current usage metrics is available 48-96 hours after online publication and is updated daily on week days.
Initial download of the metrics may take a while.