Open Access
Fig. 9.
Download original image
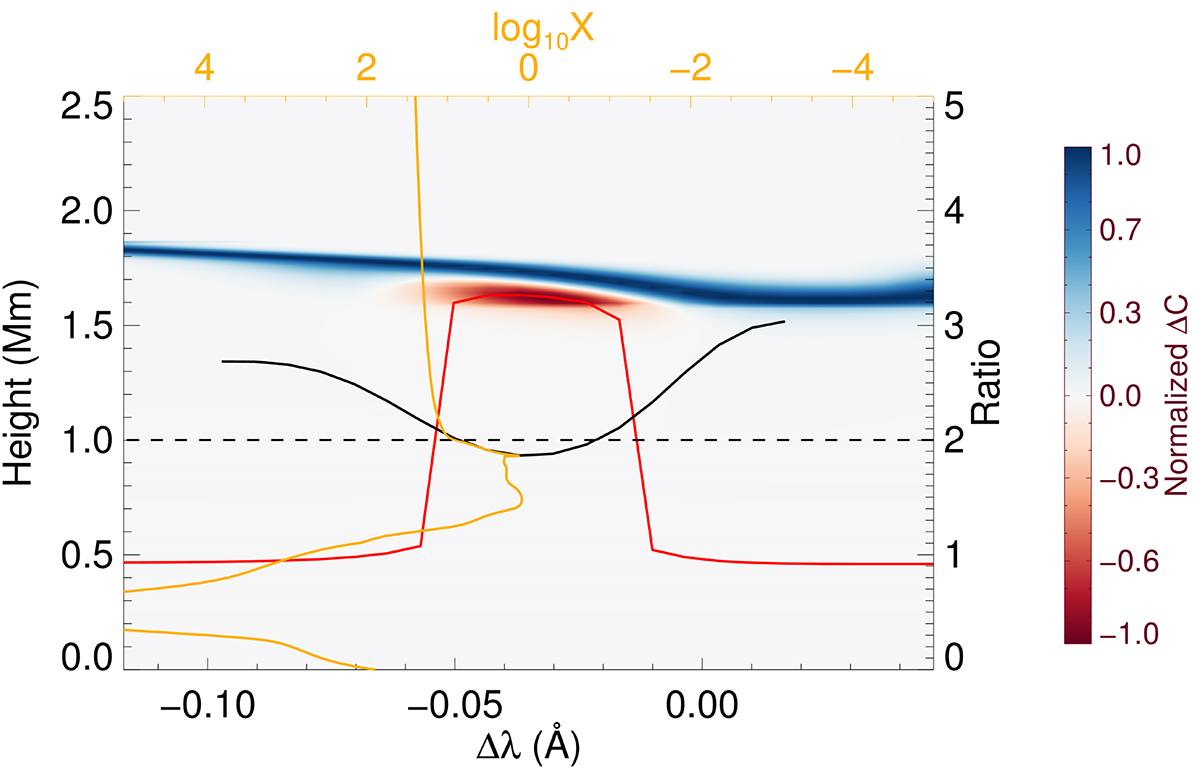
Normalized difference of the contribution functions (ΔC) at 8.0 s in Case f10E25d3 (background). The intensity ratio profile is marked as the black line. The red line denotes the τ = 1 height and the orange line refers to the proportion of resonance scattering to thermal emission (X).
Current usage metrics show cumulative count of Article Views (full-text article views including HTML views, PDF and ePub downloads, according to the available data) and Abstracts Views on Vision4Press platform.
Data correspond to usage on the plateform after 2015. The current usage metrics is available 48-96 hours after online publication and is updated daily on week days.
Initial download of the metrics may take a while.