Fig. 8.
Download original image
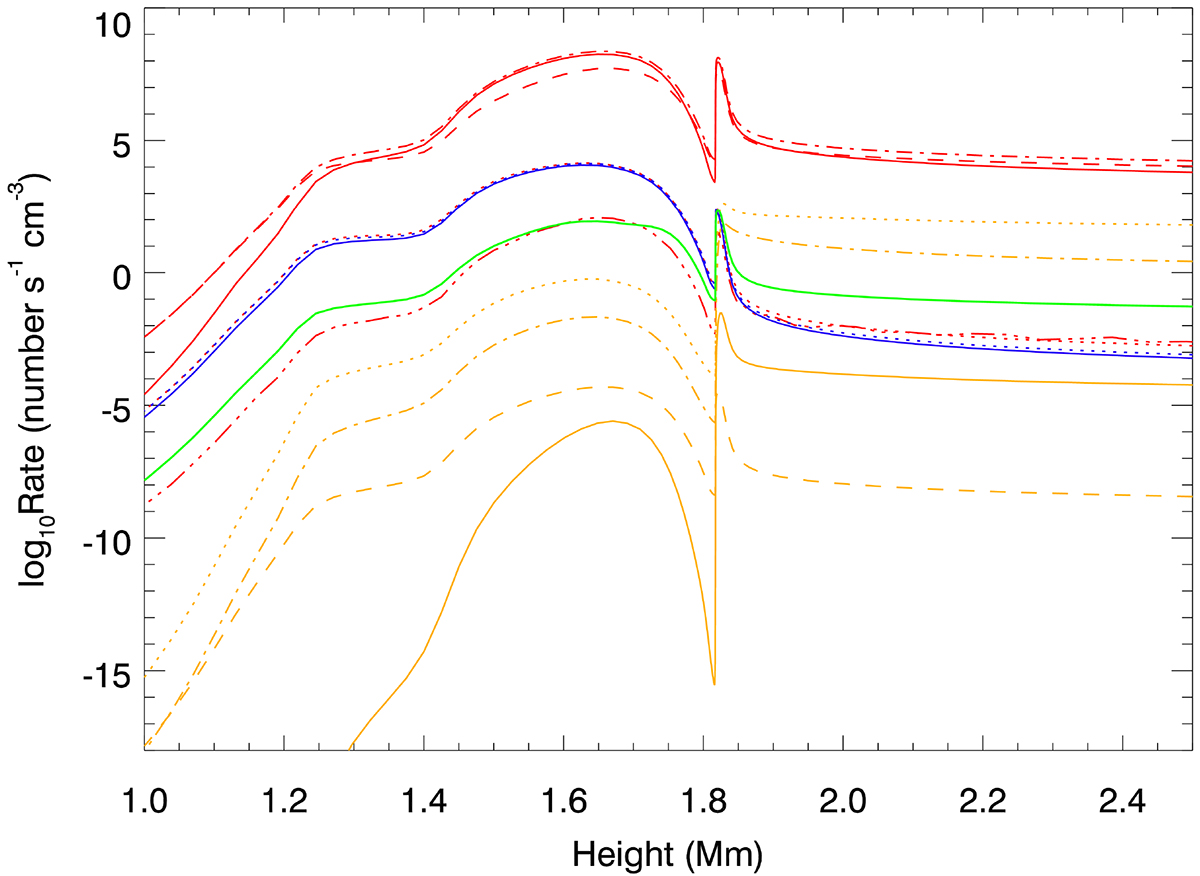
Height distribution of all the transition rates in Eq. (4) for Case f10E25d3 at 6.0 s. Red lines represent the transitions between levels 0 and 1: n0C01 (red solid line), n1C10 (red dotted line), n0R01 (red dashed line), n1A10 (red dotted-dashed line), and ![]() (red three-dotted-dashed line). Blue lines represent transitions between levels 1 and 2: n1C12 (blue solid line) and n2C21 (blue dotted line). Yellow lines represent transitions between level 1 and the continuum: n1C1c (yellow solid line), ncCc1 (yellow dotted line), n1R1c (yellow dashed line), and ncRc1 (yellow dotted-dashed line). The net rate dn1/dt is plotted as the green line.
(red three-dotted-dashed line). Blue lines represent transitions between levels 1 and 2: n1C12 (blue solid line) and n2C21 (blue dotted line). Yellow lines represent transitions between level 1 and the continuum: n1C1c (yellow solid line), ncCc1 (yellow dotted line), n1R1c (yellow dashed line), and ncRc1 (yellow dotted-dashed line). The net rate dn1/dt is plotted as the green line.
Current usage metrics show cumulative count of Article Views (full-text article views including HTML views, PDF and ePub downloads, according to the available data) and Abstracts Views on Vision4Press platform.
Data correspond to usage on the plateform after 2015. The current usage metrics is available 48-96 hours after online publication and is updated daily on week days.
Initial download of the metrics may take a while.