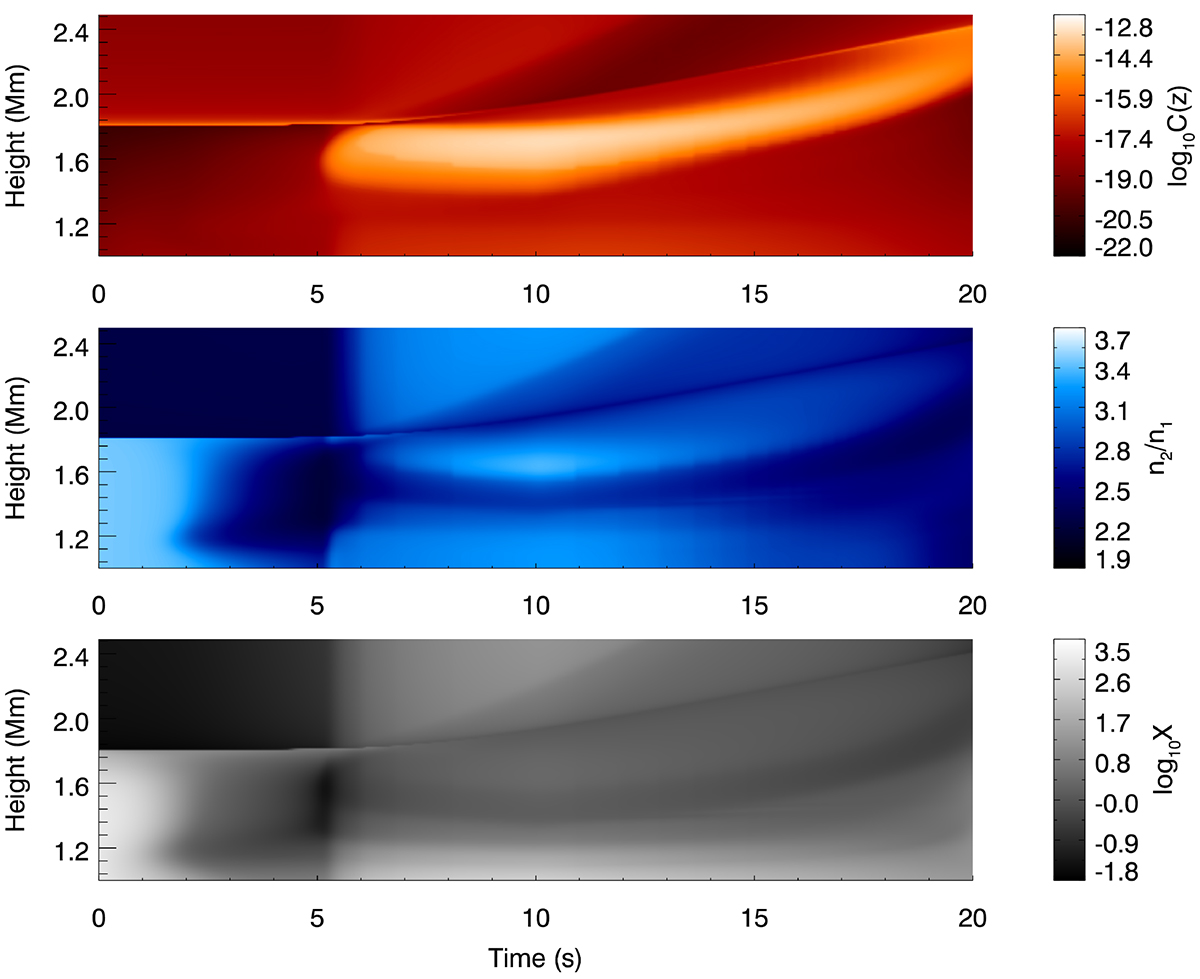
Fig. 7.
Download original image
Time evolution of the height distribution of the contribution function at the line core (top panel), the population ratio n2/n1 (middle panel), and the proportion of the resonance scattering to thermal emission X (bottom panel) for Case f10E15d3. An obvious enhancement of the contribution function in the chromosphere starts from t = 5.0 s.
Current usage metrics show cumulative count of Article Views (full-text article views including HTML views, PDF and ePub downloads, according to the available data) and Abstracts Views on Vision4Press platform.
Data correspond to usage on the plateform after 2015. The current usage metrics is available 48-96 hours after online publication and is updated daily on week days.
Initial download of the metrics may take a while.