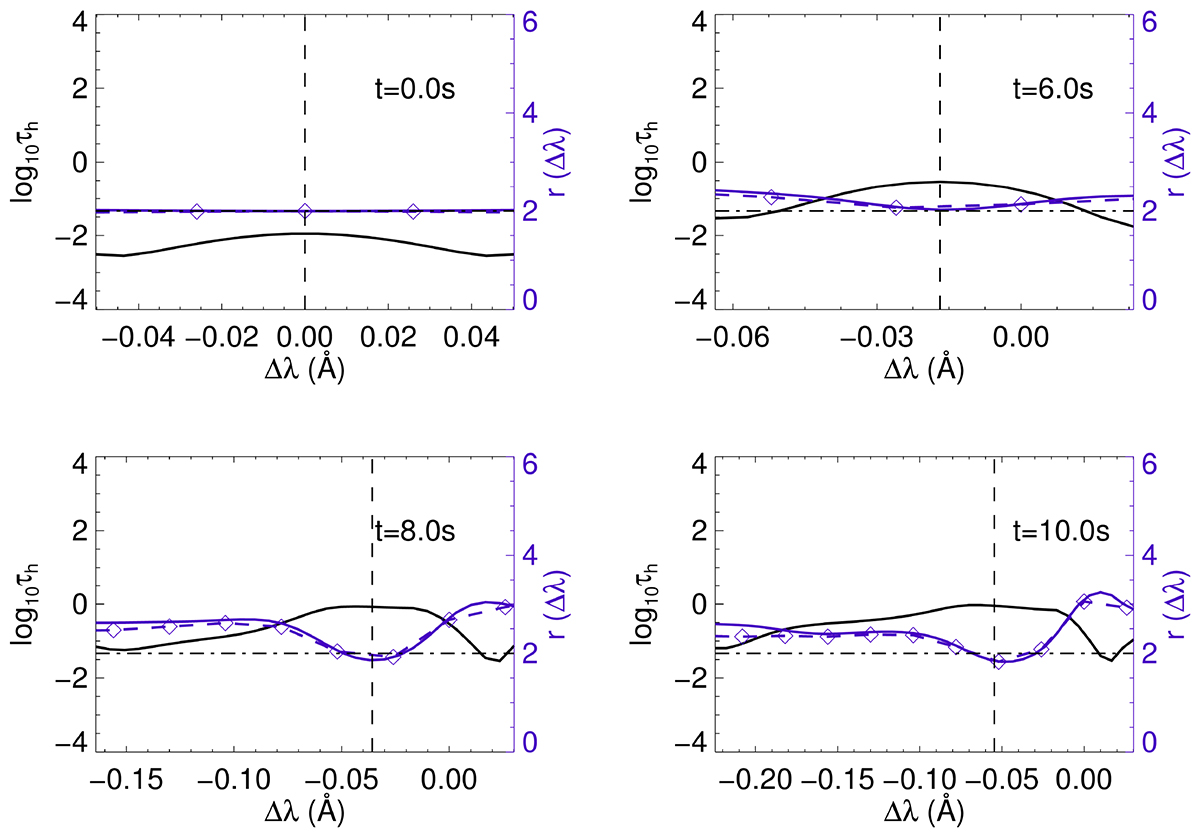
Fig. 5.
Download original image
Optical depth at the line formation height τh (black line) and the intensity ratio profile r(Δλ), (blue solid line) for Case f10E25d3. We only show the wavelength range at which the emergent intensity is larger than three times the continuum. The blue dashed lines show r(Δλ) which is degraded to the IRIS spectral resolution (0.026 Å). Overplotted are the horizontal line of r = 2 and the vertical line for the position of the line core.
Current usage metrics show cumulative count of Article Views (full-text article views including HTML views, PDF and ePub downloads, according to the available data) and Abstracts Views on Vision4Press platform.
Data correspond to usage on the plateform after 2015. The current usage metrics is available 48-96 hours after online publication and is updated daily on week days.
Initial download of the metrics may take a while.