Open Access
Fig. 4.
Download original image
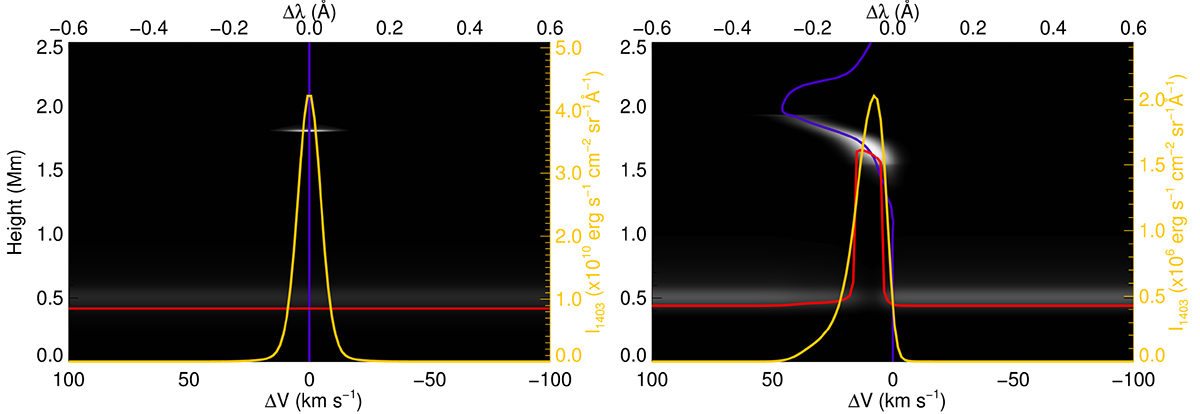
Line formation of the Si IV 1403 Å line in Case f10E25d3, for t = 0 s on the left panel and t = 10 s on the right panel. Background gray shades represent the contribution function. Blue lines denote the vertical velocity and red lines denote the τλ = 1 height. Orange lines refer to the line profiles.
Current usage metrics show cumulative count of Article Views (full-text article views including HTML views, PDF and ePub downloads, according to the available data) and Abstracts Views on Vision4Press platform.
Data correspond to usage on the plateform after 2015. The current usage metrics is available 48-96 hours after online publication and is updated daily on week days.
Initial download of the metrics may take a while.