Open Access
Fig. 3.
Download original image
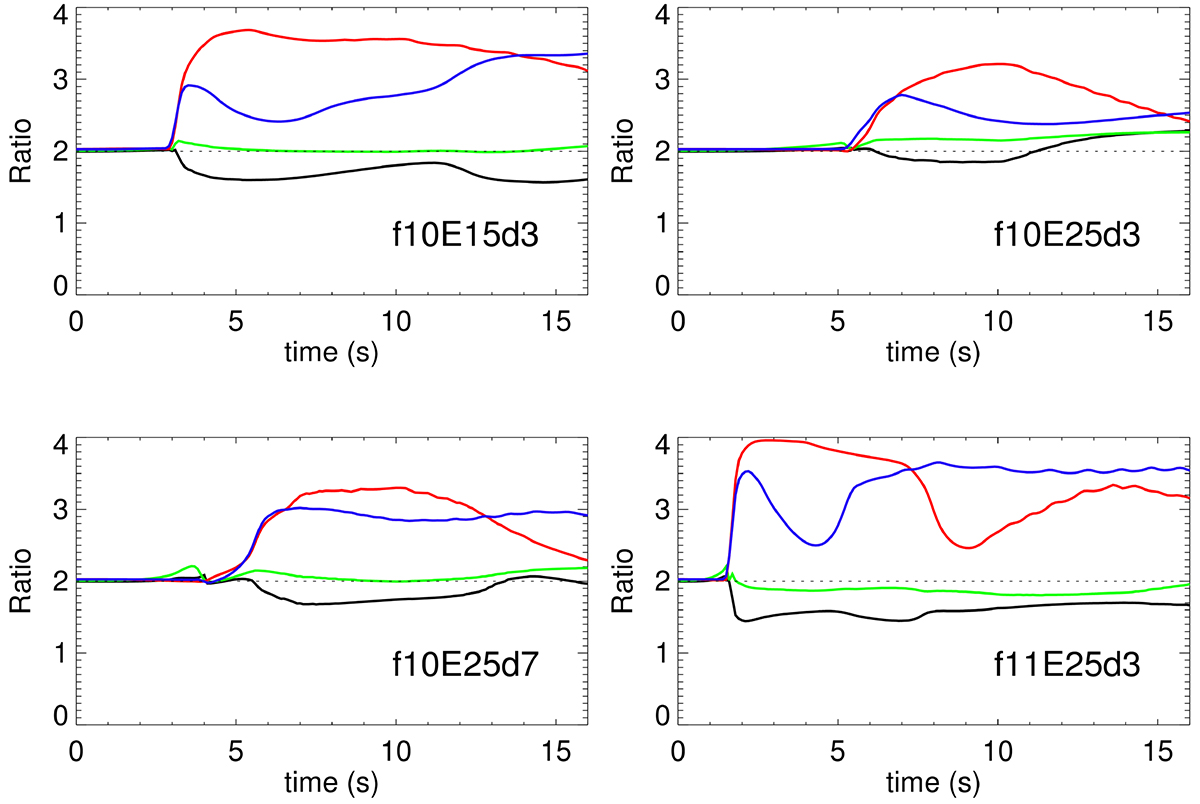
Time variations of the ratio at the red wing (red solid line), the blue wing (blue solid line), the line core (black solid line), and the ratio of integrated intensity (green solid line) in four cases. The wavelength positions for the line core, the red wing, and the blue wing in each case are marked in Fig. 1.
Current usage metrics show cumulative count of Article Views (full-text article views including HTML views, PDF and ePub downloads, according to the available data) and Abstracts Views on Vision4Press platform.
Data correspond to usage on the plateform after 2015. The current usage metrics is available 48-96 hours after online publication and is updated daily on week days.
Initial download of the metrics may take a while.